Vietnamese vs Yup'ik Unemployment Among Ages 65 to 74 years
COMPARE
Vietnamese
Yup'ik
Unemployment Among Ages 65 to 74 years
Unemployment Among Ages 65 to 74 years Comparison
Vietnamese
Yup'ik
5.9%
UNEMPLOYMENT AMONG AGES 65 TO 74 YEARS
0.0/ 100
METRIC RATING
313th/ 347
METRIC RANK
9.5%
UNEMPLOYMENT AMONG AGES 65 TO 74 YEARS
0.0/ 100
METRIC RATING
346th/ 347
METRIC RANK
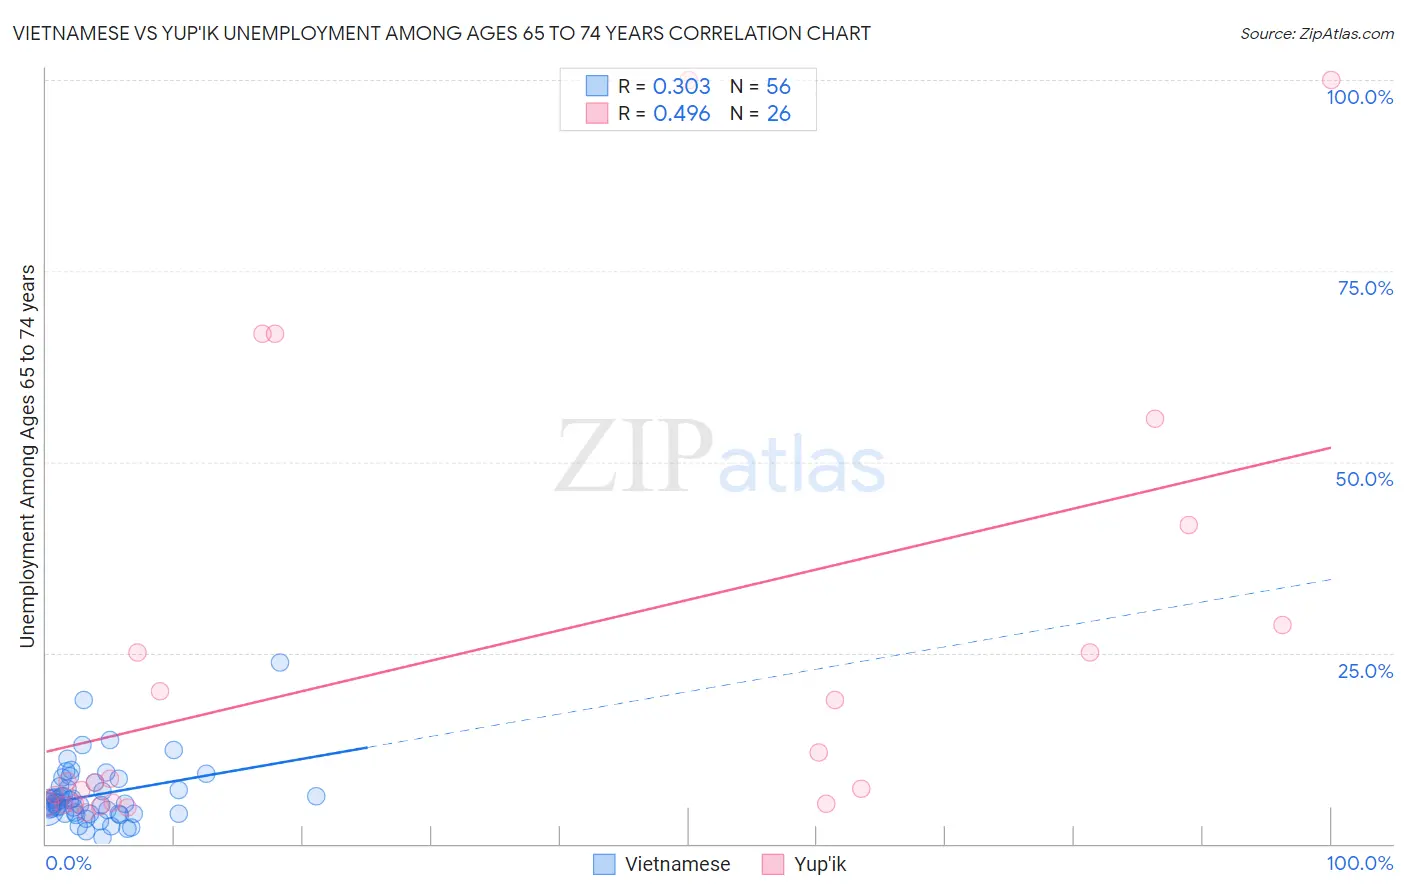
Vietnamese vs Yup'ik Unemployment Among Ages 65 to 74 years Correlation Chart
The statistical analysis conducted on geographies consisting of 162,170,002 people shows a mild positive correlation between the proportion of Vietnamese and unemployment rate among population between the ages 65 and 74 in the United States with a correlation coefficient (R) of 0.303 and weighted average of 5.9%. Similarly, the statistical analysis conducted on geographies consisting of 38,042,945 people shows a moderate positive correlation between the proportion of Yup'ik and unemployment rate among population between the ages 65 and 74 in the United States with a correlation coefficient (R) of 0.496 and weighted average of 9.5%, a difference of 61.3%.
Unemployment Among Ages 65 to 74 years Correlation Summary
| Measurement | Vietnamese | Yup'ik |
| Minimum | 0.80% | 4.1% |
| Maximum | 23.7% | 100.0% |
| Range | 22.9% | 95.9% |
| Mean | 6.4% | 24.8% |
| Median | 5.3% | 8.4% |
| Interquartile 25% (IQ1) | 4.0% | 5.3% |
| Interquartile 75% (IQ3) | 7.8% | 28.6% |
| Interquartile Range (IQR) | 3.8% | 23.3% |
| Standard Deviation (Sample) | 4.0% | 29.1% |
| Standard Deviation (Population) | 4.0% | 28.6% |
Similar Demographics by Unemployment Among Ages 65 to 74 years
Demographics Similar to Vietnamese by Unemployment Among Ages 65 to 74 years
In terms of unemployment among ages 65 to 74 years, the demographic groups most similar to Vietnamese are Immigrants from Venezuela (5.9%, a difference of 0.17%), Immigrants from Guatemala (5.9%, a difference of 0.18%), Hispanic or Latino (5.9%, a difference of 0.19%), Venezuelan (5.9%, a difference of 0.21%), and Immigrants from Bangladesh (5.9%, a difference of 0.25%).
| Demographics | Rating | Rank | Unemployment Among Ages 65 to 74 years |
| Cheyenne | 0.0 /100 | #306 | Tragic 5.8% |
| British West Indians | 0.0 /100 | #307 | Tragic 5.8% |
| Guatemalans | 0.0 /100 | #308 | Tragic 5.8% |
| Immigrants | Ecuador | 0.0 /100 | #309 | Tragic 5.8% |
| Immigrants | Bangladesh | 0.0 /100 | #310 | Tragic 5.9% |
| Venezuelans | 0.0 /100 | #311 | Tragic 5.9% |
| Hispanics or Latinos | 0.0 /100 | #312 | Tragic 5.9% |
| Vietnamese | 0.0 /100 | #313 | Tragic 5.9% |
| Immigrants | Venezuela | 0.0 /100 | #314 | Tragic 5.9% |
| Immigrants | Guatemala | 0.0 /100 | #315 | Tragic 5.9% |
| Immigrants | El Salvador | 0.0 /100 | #316 | Tragic 5.9% |
| Immigrants | Central America | 0.0 /100 | #317 | Tragic 5.9% |
| Zimbabweans | 0.0 /100 | #318 | Tragic 5.9% |
| Aleuts | 0.0 /100 | #319 | Tragic 5.9% |
| Immigrants | Bahamas | 0.0 /100 | #320 | Tragic 5.9% |
Demographics Similar to Yup'ik by Unemployment Among Ages 65 to 74 years
In terms of unemployment among ages 65 to 74 years, the demographic groups most similar to Yup'ik are Immigrants from Yemen (8.3%, a difference of 14.6%), Inupiat (7.5%, a difference of 26.3%), Alaskan Athabascan (7.4%, a difference of 28.7%), Navajo (6.9%, a difference of 36.6%), and Alaska Native (6.8%, a difference of 38.6%).
| Demographics | Rating | Rank | Unemployment Among Ages 65 to 74 years |
| Paiute | 0.0 /100 | #333 | Tragic 6.3% |
| Taiwanese | 0.0 /100 | #334 | Tragic 6.3% |
| Puerto Ricans | 0.0 /100 | #335 | Tragic 6.4% |
| Immigrants | Armenia | 0.0 /100 | #336 | Tragic 6.5% |
| Ute | 0.0 /100 | #337 | Tragic 6.5% |
| Tlingit-Haida | 0.0 /100 | #338 | Tragic 6.5% |
| Yakama | 0.0 /100 | #339 | Tragic 6.6% |
| Pima | 0.0 /100 | #340 | Tragic 6.6% |
| Alaska Natives | 0.0 /100 | #341 | Tragic 6.8% |
| Navajo | 0.0 /100 | #342 | Tragic 6.9% |
| Alaskan Athabascans | 0.0 /100 | #343 | Tragic 7.4% |
| Inupiat | 0.0 /100 | #344 | Tragic 7.5% |
| Immigrants | Yemen | 0.0 /100 | #345 | Tragic 8.3% |
| Yup'ik | 0.0 /100 | #346 | Tragic 9.5% |
| Crow | 0.0 /100 | #347 | Tragic 17.4% |