Immigrants from Ukraine vs Immigrants from Pakistan Unemployment Among Ages 55 to 59 years
COMPARE
Immigrants from Ukraine
Immigrants from Pakistan
Unemployment Among Ages 55 to 59 years
Unemployment Among Ages 55 to 59 years Comparison
Immigrants from Ukraine
Immigrants from Pakistan
4.9%
UNEMPLOYMENT AMONG AGES 55 TO 59 YEARS
31.7/ 100
METRIC RATING
192nd/ 347
METRIC RANK
4.5%
UNEMPLOYMENT AMONG AGES 55 TO 59 YEARS
99.7/ 100
METRIC RATING
50th/ 347
METRIC RANK
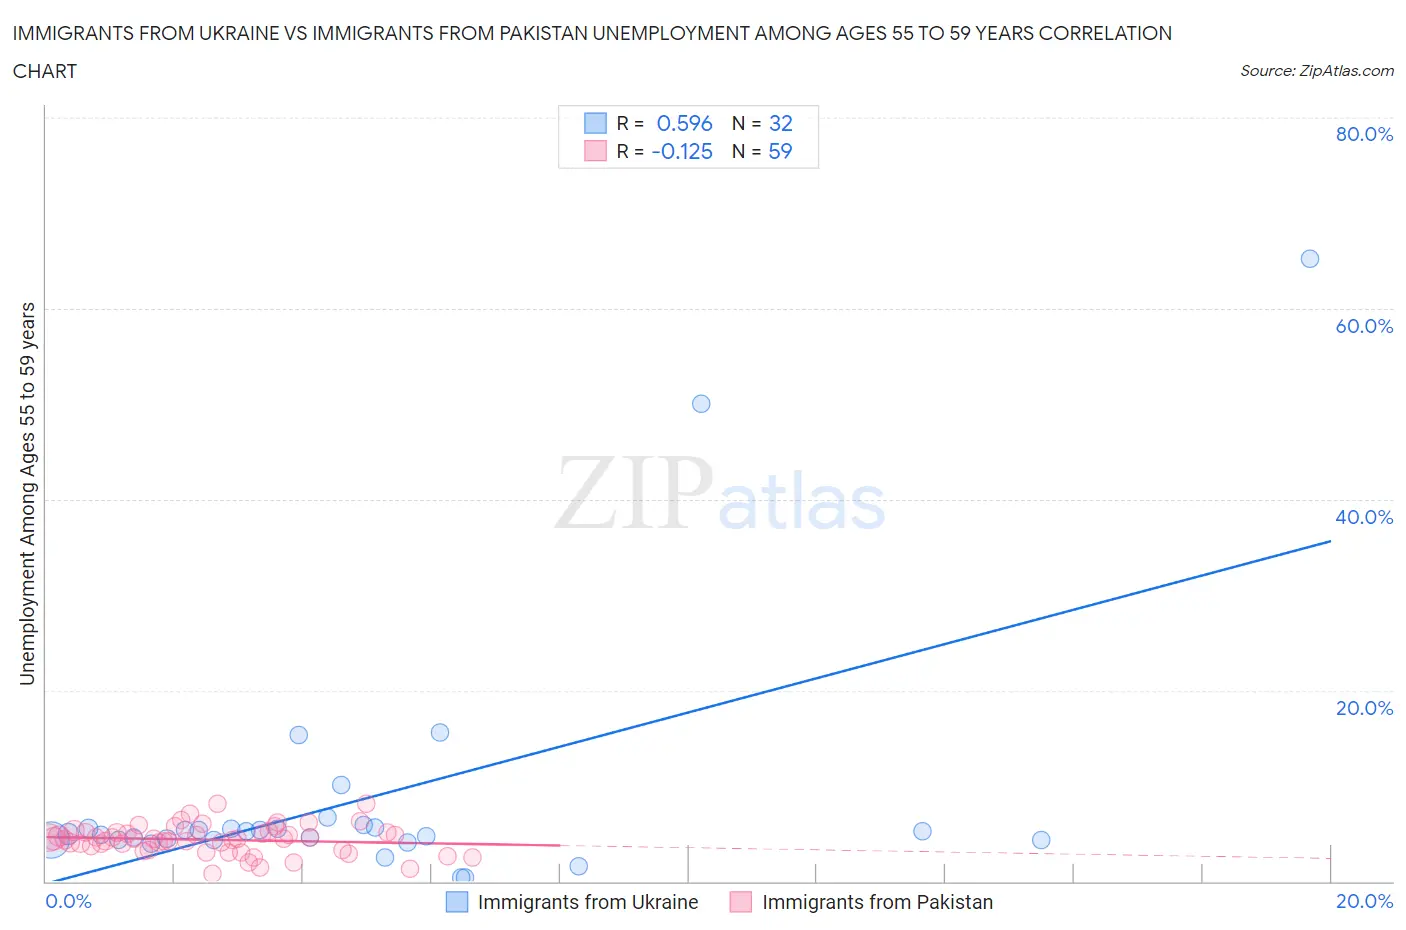
Immigrants from Ukraine vs Immigrants from Pakistan Unemployment Among Ages 55 to 59 years Correlation Chart
The statistical analysis conducted on geographies consisting of 275,396,465 people shows a substantial positive correlation between the proportion of Immigrants from Ukraine and unemployment rate among population between the ages 55 and 59 in the United States with a correlation coefficient (R) of 0.596 and weighted average of 4.9%. Similarly, the statistical analysis conducted on geographies consisting of 272,090,951 people shows a poor negative correlation between the proportion of Immigrants from Pakistan and unemployment rate among population between the ages 55 and 59 in the United States with a correlation coefficient (R) of -0.125 and weighted average of 4.5%, a difference of 7.2%.
Unemployment Among Ages 55 to 59 years Correlation Summary
| Measurement | Immigrants from Ukraine | Immigrants from Pakistan |
| Minimum | 0.40% | 0.80% |
| Maximum | 65.2% | 8.1% |
| Range | 64.8% | 7.3% |
| Mean | 8.6% | 4.4% |
| Median | 5.1% | 4.4% |
| Interquartile 25% (IQ1) | 4.3% | 3.3% |
| Interquartile 75% (IQ3) | 5.6% | 5.1% |
| Interquartile Range (IQR) | 1.2% | 1.8% |
| Standard Deviation (Sample) | 13.4% | 1.5% |
| Standard Deviation (Population) | 13.2% | 1.5% |
Similar Demographics by Unemployment Among Ages 55 to 59 years
Demographics Similar to Immigrants from Ukraine by Unemployment Among Ages 55 to 59 years
In terms of unemployment among ages 55 to 59 years, the demographic groups most similar to Immigrants from Ukraine are Iranian (4.9%, a difference of 0.040%), Immigrants from Italy (4.9%, a difference of 0.070%), Russian (4.9%, a difference of 0.10%), Iroquois (4.9%, a difference of 0.13%), and Immigrants from Eastern Asia (4.8%, a difference of 0.20%).
| Demographics | Rating | Rank | Unemployment Among Ages 55 to 59 years |
| Peruvians | 37.0 /100 | #185 | Fair 4.8% |
| Osage | 37.0 /100 | #186 | Fair 4.8% |
| Immigrants | Morocco | 36.5 /100 | #187 | Fair 4.8% |
| Immigrants | Eastern Asia | 36.1 /100 | #188 | Fair 4.8% |
| Iroquois | 34.5 /100 | #189 | Fair 4.9% |
| Russians | 33.9 /100 | #190 | Fair 4.9% |
| Iranians | 32.4 /100 | #191 | Fair 4.9% |
| Immigrants | Ukraine | 31.7 /100 | #192 | Fair 4.9% |
| Immigrants | Italy | 30.1 /100 | #193 | Fair 4.9% |
| Spaniards | 27.2 /100 | #194 | Fair 4.9% |
| Estonians | 27.2 /100 | #195 | Fair 4.9% |
| Eastern Europeans | 26.7 /100 | #196 | Fair 4.9% |
| Macedonians | 26.4 /100 | #197 | Fair 4.9% |
| Immigrants | Philippines | 26.1 /100 | #198 | Fair 4.9% |
| Immigrants | Russia | 23.7 /100 | #199 | Fair 4.9% |
Demographics Similar to Immigrants from Pakistan by Unemployment Among Ages 55 to 59 years
In terms of unemployment among ages 55 to 59 years, the demographic groups most similar to Immigrants from Pakistan are Immigrants from Saudi Arabia (4.5%, a difference of 0.020%), Maltese (4.5%, a difference of 0.030%), Immigrants from Moldova (4.5%, a difference of 0.040%), Scottish (4.5%, a difference of 0.14%), and Immigrants from Middle Africa (4.5%, a difference of 0.15%).
| Demographics | Rating | Rank | Unemployment Among Ages 55 to 59 years |
| Immigrants | Korea | 99.8 /100 | #43 | Exceptional 4.5% |
| Europeans | 99.8 /100 | #44 | Exceptional 4.5% |
| British | 99.8 /100 | #45 | Exceptional 4.5% |
| Immigrants | Zaire | 99.8 /100 | #46 | Exceptional 4.5% |
| German Russians | 99.8 /100 | #47 | Exceptional 4.5% |
| Immigrants | Moldova | 99.7 /100 | #48 | Exceptional 4.5% |
| Immigrants | Saudi Arabia | 99.7 /100 | #49 | Exceptional 4.5% |
| Immigrants | Pakistan | 99.7 /100 | #50 | Exceptional 4.5% |
| Maltese | 99.7 /100 | #51 | Exceptional 4.5% |
| Scottish | 99.7 /100 | #52 | Exceptional 4.5% |
| Immigrants | Middle Africa | 99.7 /100 | #53 | Exceptional 4.5% |
| Burmese | 99.7 /100 | #54 | Exceptional 4.5% |
| Immigrants | Nepal | 99.6 /100 | #55 | Exceptional 4.5% |
| Welsh | 99.6 /100 | #56 | Exceptional 4.5% |
| Northern Europeans | 99.6 /100 | #57 | Exceptional 4.5% |