Assyrian/Chaldean/Syriac vs Immigrants from Pakistan Unemployment Among Ages 55 to 59 years
COMPARE
Assyrian/Chaldean/Syriac
Immigrants from Pakistan
Unemployment Among Ages 55 to 59 years
Unemployment Among Ages 55 to 59 years Comparison
Assyrians/Chaldeans/Syriacs
Immigrants from Pakistan
4.5%
UNEMPLOYMENT AMONG AGES 55 TO 59 YEARS
99.9/ 100
METRIC RATING
38th/ 347
METRIC RANK
4.5%
UNEMPLOYMENT AMONG AGES 55 TO 59 YEARS
99.7/ 100
METRIC RATING
50th/ 347
METRIC RANK
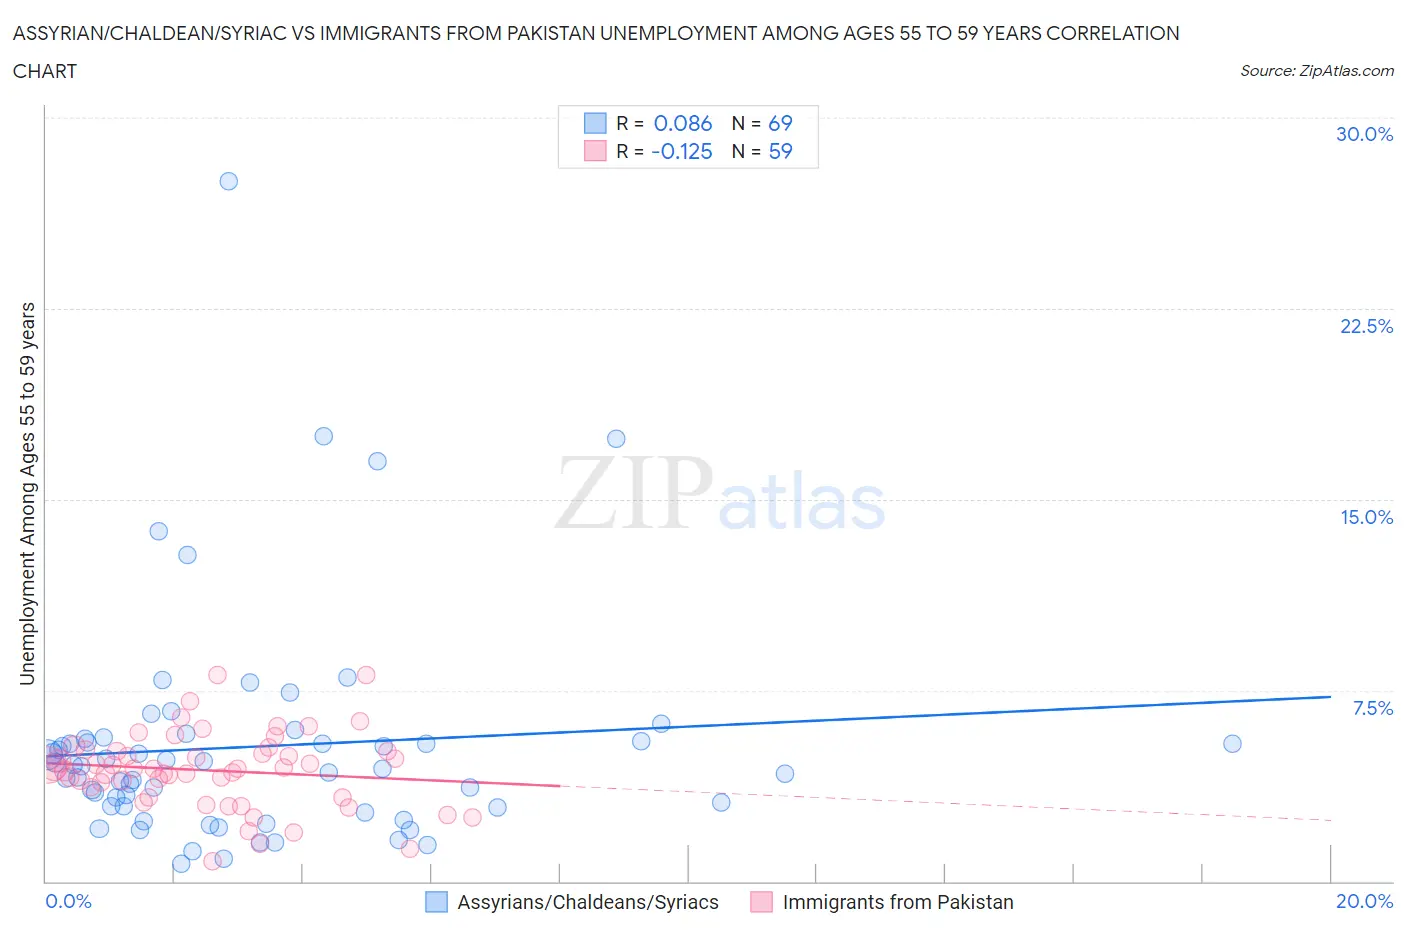
Assyrian/Chaldean/Syriac vs Immigrants from Pakistan Unemployment Among Ages 55 to 59 years Correlation Chart
The statistical analysis conducted on geographies consisting of 108,497,216 people shows a slight positive correlation between the proportion of Assyrians/Chaldeans/Syriacs and unemployment rate among population between the ages 55 and 59 in the United States with a correlation coefficient (R) of 0.086 and weighted average of 4.5%. Similarly, the statistical analysis conducted on geographies consisting of 272,090,951 people shows a poor negative correlation between the proportion of Immigrants from Pakistan and unemployment rate among population between the ages 55 and 59 in the United States with a correlation coefficient (R) of -0.125 and weighted average of 4.5%, a difference of 0.98%.
Unemployment Among Ages 55 to 59 years Correlation Summary
| Measurement | Assyrian/Chaldean/Syriac | Immigrants from Pakistan |
| Minimum | 0.69% | 0.80% |
| Maximum | 27.5% | 8.1% |
| Range | 26.8% | 7.3% |
| Mean | 5.3% | 4.4% |
| Median | 4.5% | 4.4% |
| Interquartile 25% (IQ1) | 2.9% | 3.3% |
| Interquartile 75% (IQ3) | 5.6% | 5.1% |
| Interquartile Range (IQR) | 2.6% | 1.8% |
| Standard Deviation (Sample) | 4.4% | 1.5% |
| Standard Deviation (Population) | 4.4% | 1.5% |
Demographics Similar to Assyrians/Chaldeans/Syriacs and Immigrants from Pakistan by Unemployment Among Ages 55 to 59 years
In terms of unemployment among ages 55 to 59 years, the demographic groups most similar to Assyrians/Chaldeans/Syriacs are Ethiopian (4.5%, a difference of 0.18%), Immigrants from Bulgaria (4.5%, a difference of 0.18%), English (4.5%, a difference of 0.26%), Cypriot (4.5%, a difference of 0.27%), and Thai (4.5%, a difference of 0.29%). Similarly, the demographic groups most similar to Immigrants from Pakistan are Immigrants from Saudi Arabia (4.5%, a difference of 0.020%), Maltese (4.5%, a difference of 0.030%), Immigrants from Moldova (4.5%, a difference of 0.040%), Scottish (4.5%, a difference of 0.14%), and Immigrants from Middle Africa (4.5%, a difference of 0.15%).
| Demographics | Rating | Rank | Unemployment Among Ages 55 to 59 years |
| Thais | 99.9 /100 | #34 | Exceptional 4.5% |
| Cypriots | 99.9 /100 | #35 | Exceptional 4.5% |
| Ethiopians | 99.9 /100 | #36 | Exceptional 4.5% |
| Immigrants | Bulgaria | 99.9 /100 | #37 | Exceptional 4.5% |
| Assyrians/Chaldeans/Syriacs | 99.9 /100 | #38 | Exceptional 4.5% |
| English | 99.9 /100 | #39 | Exceptional 4.5% |
| Swiss | 99.8 /100 | #40 | Exceptional 4.5% |
| Luxembourgers | 99.8 /100 | #41 | Exceptional 4.5% |
| Immigrants | Kuwait | 99.8 /100 | #42 | Exceptional 4.5% |
| Immigrants | Korea | 99.8 /100 | #43 | Exceptional 4.5% |
| Europeans | 99.8 /100 | #44 | Exceptional 4.5% |
| British | 99.8 /100 | #45 | Exceptional 4.5% |
| Immigrants | Zaire | 99.8 /100 | #46 | Exceptional 4.5% |
| German Russians | 99.8 /100 | #47 | Exceptional 4.5% |
| Immigrants | Moldova | 99.7 /100 | #48 | Exceptional 4.5% |
| Immigrants | Saudi Arabia | 99.7 /100 | #49 | Exceptional 4.5% |
| Immigrants | Pakistan | 99.7 /100 | #50 | Exceptional 4.5% |
| Maltese | 99.7 /100 | #51 | Exceptional 4.5% |
| Scottish | 99.7 /100 | #52 | Exceptional 4.5% |
| Immigrants | Middle Africa | 99.7 /100 | #53 | Exceptional 4.5% |
| Burmese | 99.7 /100 | #54 | Exceptional 4.5% |