Immigrants from Ukraine vs Comanche Unemployment Among Ages 55 to 59 years
COMPARE
Immigrants from Ukraine
Comanche
Unemployment Among Ages 55 to 59 years
Unemployment Among Ages 55 to 59 years Comparison
Immigrants from Ukraine
Comanche
4.9%
UNEMPLOYMENT AMONG AGES 55 TO 59 YEARS
31.7/ 100
METRIC RATING
192nd/ 347
METRIC RANK
5.1%
UNEMPLOYMENT AMONG AGES 55 TO 59 YEARS
0.4/ 100
METRIC RATING
249th/ 347
METRIC RANK
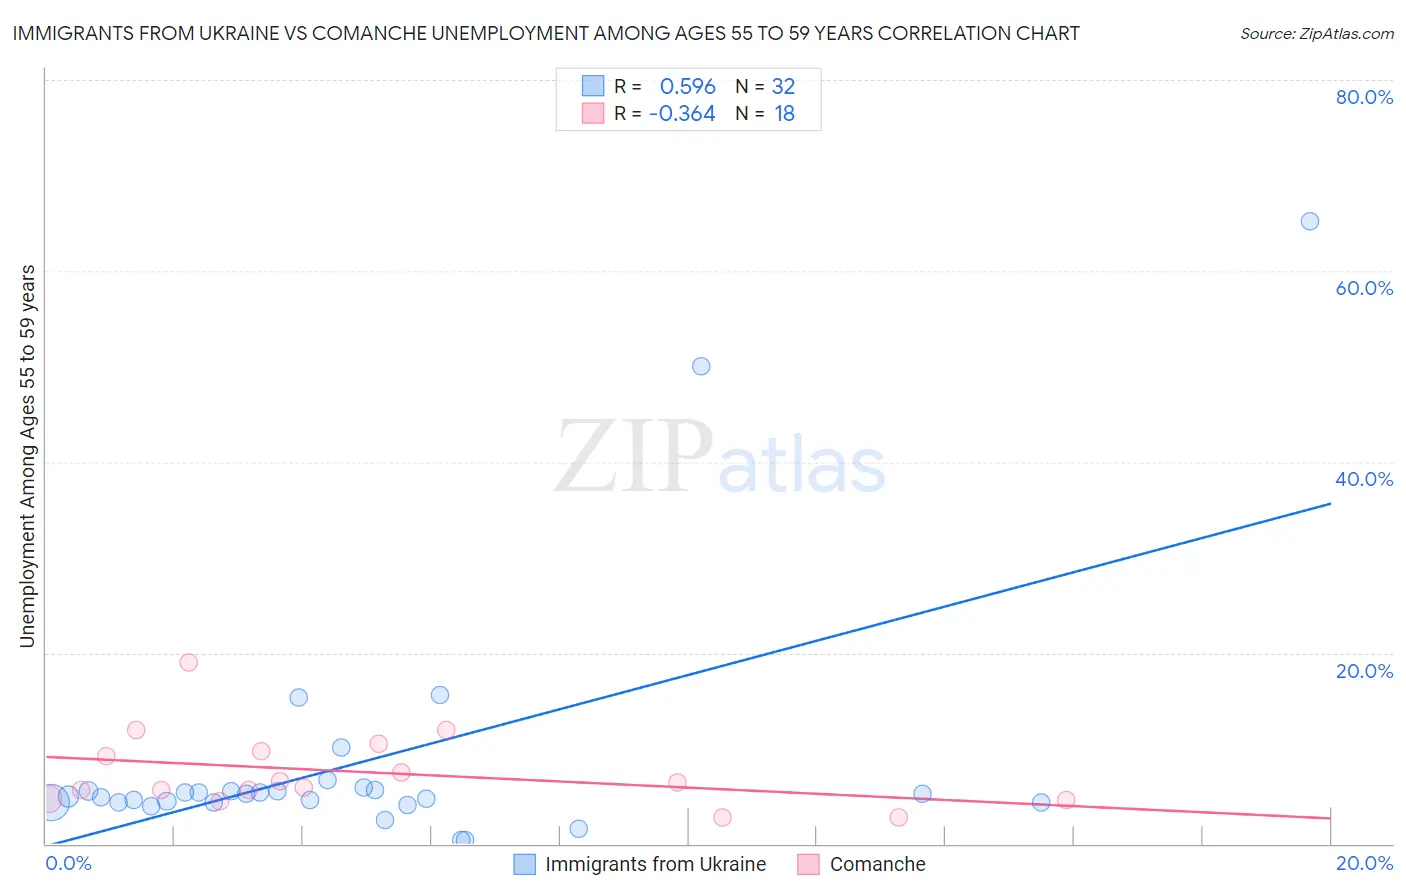
Immigrants from Ukraine vs Comanche Unemployment Among Ages 55 to 59 years Correlation Chart
The statistical analysis conducted on geographies consisting of 275,396,465 people shows a substantial positive correlation between the proportion of Immigrants from Ukraine and unemployment rate among population between the ages 55 and 59 in the United States with a correlation coefficient (R) of 0.596 and weighted average of 4.9%. Similarly, the statistical analysis conducted on geographies consisting of 105,765,687 people shows a mild negative correlation between the proportion of Comanche and unemployment rate among population between the ages 55 and 59 in the United States with a correlation coefficient (R) of -0.364 and weighted average of 5.1%, a difference of 4.7%.
Unemployment Among Ages 55 to 59 years Correlation Summary
| Measurement | Immigrants from Ukraine | Comanche |
| Minimum | 0.40% | 2.8% |
| Maximum | 65.2% | 19.0% |
| Range | 64.8% | 16.2% |
| Mean | 8.6% | 7.5% |
| Median | 5.1% | 6.2% |
| Interquartile 25% (IQ1) | 4.3% | 4.7% |
| Interquartile 75% (IQ3) | 5.6% | 9.6% |
| Interquartile Range (IQR) | 1.2% | 5.0% |
| Standard Deviation (Sample) | 13.4% | 4.0% |
| Standard Deviation (Population) | 13.2% | 3.9% |
Similar Demographics by Unemployment Among Ages 55 to 59 years
Demographics Similar to Immigrants from Ukraine by Unemployment Among Ages 55 to 59 years
In terms of unemployment among ages 55 to 59 years, the demographic groups most similar to Immigrants from Ukraine are Iranian (4.9%, a difference of 0.040%), Immigrants from Italy (4.9%, a difference of 0.070%), Russian (4.9%, a difference of 0.10%), Iroquois (4.9%, a difference of 0.13%), and Immigrants from Eastern Asia (4.8%, a difference of 0.20%).
| Demographics | Rating | Rank | Unemployment Among Ages 55 to 59 years |
| Peruvians | 37.0 /100 | #185 | Fair 4.8% |
| Osage | 37.0 /100 | #186 | Fair 4.8% |
| Immigrants | Morocco | 36.5 /100 | #187 | Fair 4.8% |
| Immigrants | Eastern Asia | 36.1 /100 | #188 | Fair 4.8% |
| Iroquois | 34.5 /100 | #189 | Fair 4.9% |
| Russians | 33.9 /100 | #190 | Fair 4.9% |
| Iranians | 32.4 /100 | #191 | Fair 4.9% |
| Immigrants | Ukraine | 31.7 /100 | #192 | Fair 4.9% |
| Immigrants | Italy | 30.1 /100 | #193 | Fair 4.9% |
| Spaniards | 27.2 /100 | #194 | Fair 4.9% |
| Estonians | 27.2 /100 | #195 | Fair 4.9% |
| Eastern Europeans | 26.7 /100 | #196 | Fair 4.9% |
| Macedonians | 26.4 /100 | #197 | Fair 4.9% |
| Immigrants | Philippines | 26.1 /100 | #198 | Fair 4.9% |
| Immigrants | Russia | 23.7 /100 | #199 | Fair 4.9% |
Demographics Similar to Comanche by Unemployment Among Ages 55 to 59 years
In terms of unemployment among ages 55 to 59 years, the demographic groups most similar to Comanche are Native Hawaiian (5.1%, a difference of 0.030%), Cheyenne (5.1%, a difference of 0.18%), Immigrants from Honduras (5.1%, a difference of 0.20%), Immigrants from Greece (5.1%, a difference of 0.21%), and Soviet Union (5.1%, a difference of 0.23%).
| Demographics | Rating | Rank | Unemployment Among Ages 55 to 59 years |
| Liberians | 0.9 /100 | #242 | Tragic 5.1% |
| Hondurans | 0.7 /100 | #243 | Tragic 5.1% |
| Immigrants | Fiji | 0.7 /100 | #244 | Tragic 5.1% |
| Soviet Union | 0.6 /100 | #245 | Tragic 5.1% |
| Immigrants | Greece | 0.6 /100 | #246 | Tragic 5.1% |
| Immigrants | Honduras | 0.5 /100 | #247 | Tragic 5.1% |
| Native Hawaiians | 0.5 /100 | #248 | Tragic 5.1% |
| Comanche | 0.4 /100 | #249 | Tragic 5.1% |
| Cheyenne | 0.4 /100 | #250 | Tragic 5.1% |
| Portuguese | 0.3 /100 | #251 | Tragic 5.1% |
| U.S. Virgin Islanders | 0.3 /100 | #252 | Tragic 5.1% |
| Paraguayans | 0.3 /100 | #253 | Tragic 5.1% |
| Seminole | 0.3 /100 | #254 | Tragic 5.1% |
| Blackfeet | 0.3 /100 | #255 | Tragic 5.1% |
| Senegalese | 0.3 /100 | #256 | Tragic 5.1% |