Immigrants from Uganda vs Latvian Unemployment Among Seniors over 65 years
COMPARE
Immigrants from Uganda
Latvian
Unemployment Among Seniors over 65 years
Unemployment Among Seniors over 65 years Comparison
Immigrants from Uganda
Latvians
4.8%
UNEMPLOYMENT AMONG SENIORS OVER 65 YEARS
100.0/ 100
METRIC RATING
31st/ 347
METRIC RANK
4.9%
UNEMPLOYMENT AMONG SENIORS OVER 65 YEARS
99.6/ 100
METRIC RATING
62nd/ 347
METRIC RANK
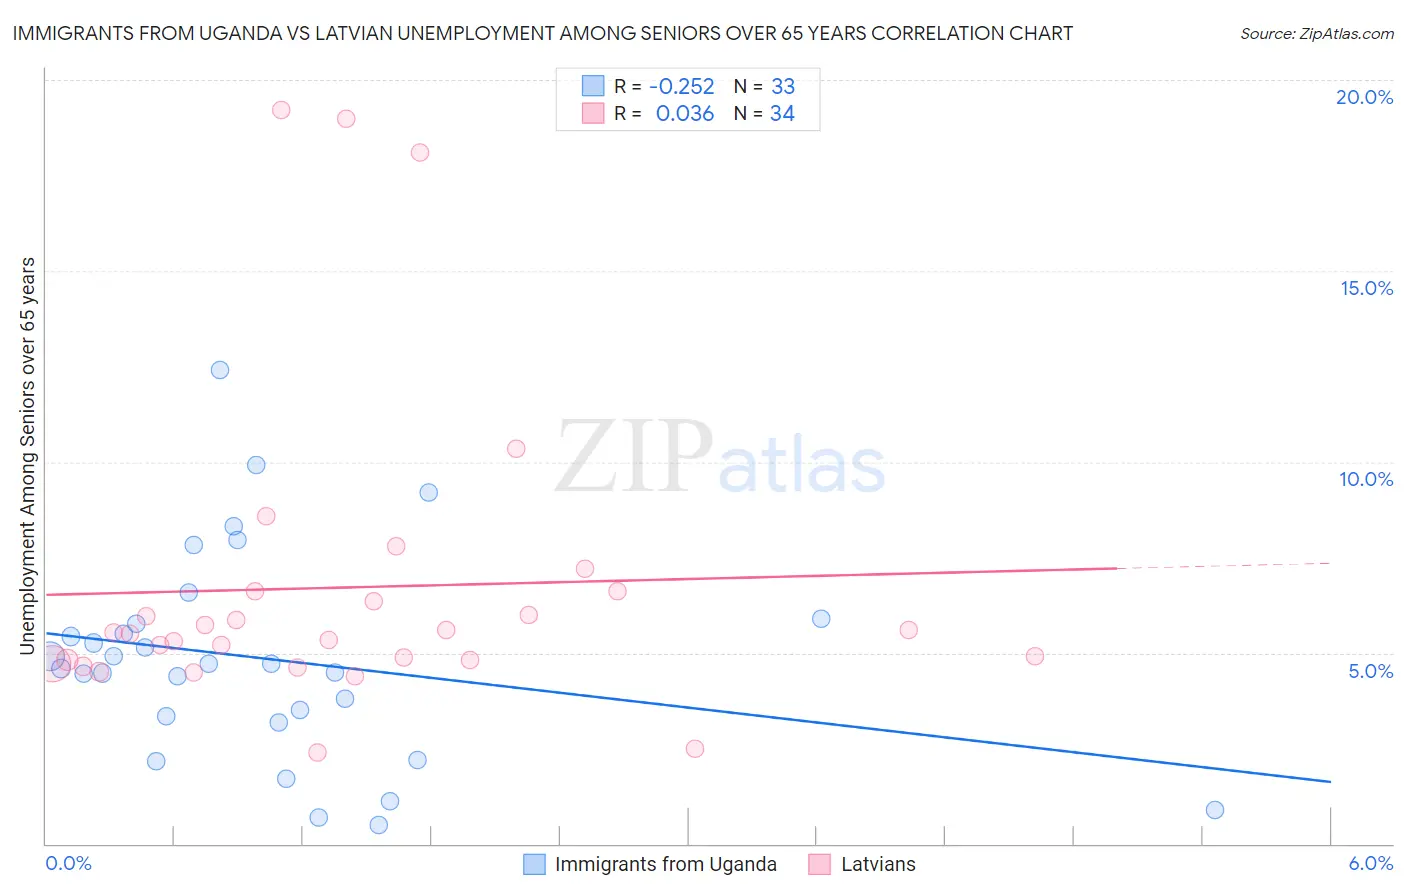
Immigrants from Uganda vs Latvian Unemployment Among Seniors over 65 years Correlation Chart
The statistical analysis conducted on geographies consisting of 122,100,264 people shows a weak negative correlation between the proportion of Immigrants from Uganda and unemployment rate amomg seniors over the age of 65 in the United States with a correlation coefficient (R) of -0.252 and weighted average of 4.8%. Similarly, the statistical analysis conducted on geographies consisting of 207,423,218 people shows no correlation between the proportion of Latvians and unemployment rate amomg seniors over the age of 65 in the United States with a correlation coefficient (R) of 0.036 and weighted average of 4.9%, a difference of 2.3%.
Unemployment Among Seniors over 65 years Correlation Summary
| Measurement | Immigrants from Uganda | Latvian |
| Minimum | 0.50% | 2.4% |
| Maximum | 12.4% | 19.2% |
| Range | 11.9% | 16.8% |
| Mean | 4.8% | 6.7% |
| Median | 4.7% | 5.5% |
| Interquartile 25% (IQ1) | 3.3% | 4.8% |
| Interquartile 75% (IQ3) | 5.8% | 6.6% |
| Interquartile Range (IQR) | 2.6% | 1.8% |
| Standard Deviation (Sample) | 2.7% | 4.1% |
| Standard Deviation (Population) | 2.7% | 4.0% |
Similar Demographics by Unemployment Among Seniors over 65 years
Demographics Similar to Immigrants from Uganda by Unemployment Among Seniors over 65 years
In terms of unemployment among seniors over 65 years, the demographic groups most similar to Immigrants from Uganda are Slovene (4.8%, a difference of 0.0%), Palestinian (4.8%, a difference of 0.090%), Belgian (4.8%, a difference of 0.20%), Bhutanese (4.8%, a difference of 0.43%), and Immigrants from Kuwait (4.8%, a difference of 0.45%).
| Demographics | Rating | Rank | Unemployment Among Seniors over 65 years |
| Iraqis | 100.0 /100 | #24 | Exceptional 4.7% |
| Tongans | 100.0 /100 | #25 | Exceptional 4.7% |
| Immigrants | Lebanon | 100.0 /100 | #26 | Exceptional 4.8% |
| Houma | 100.0 /100 | #27 | Exceptional 4.8% |
| Ugandans | 100.0 /100 | #28 | Exceptional 4.8% |
| Immigrants | North Macedonia | 100.0 /100 | #29 | Exceptional 4.8% |
| Belgians | 100.0 /100 | #30 | Exceptional 4.8% |
| Immigrants | Uganda | 100.0 /100 | #31 | Exceptional 4.8% |
| Slovenes | 100.0 /100 | #32 | Exceptional 4.8% |
| Palestinians | 100.0 /100 | #33 | Exceptional 4.8% |
| Bhutanese | 100.0 /100 | #34 | Exceptional 4.8% |
| Immigrants | Kuwait | 100.0 /100 | #35 | Exceptional 4.8% |
| Cambodians | 100.0 /100 | #36 | Exceptional 4.8% |
| Bulgarians | 99.9 /100 | #37 | Exceptional 4.8% |
| Immigrants | India | 99.9 /100 | #38 | Exceptional 4.8% |
Demographics Similar to Latvians by Unemployment Among Seniors over 65 years
In terms of unemployment among seniors over 65 years, the demographic groups most similar to Latvians are Croatian (4.9%, a difference of 0.020%), Immigrants from Cambodia (4.9%, a difference of 0.020%), Immigrants from Nicaragua (4.9%, a difference of 0.10%), English (4.9%, a difference of 0.15%), and Northern European (4.9%, a difference of 0.18%).
| Demographics | Rating | Rank | Unemployment Among Seniors over 65 years |
| Europeans | 99.8 /100 | #55 | Exceptional 4.9% |
| Carpatho Rusyns | 99.8 /100 | #56 | Exceptional 4.9% |
| Danes | 99.8 /100 | #57 | Exceptional 4.9% |
| Scandinavians | 99.8 /100 | #58 | Exceptional 4.9% |
| Immigrants | Eastern Africa | 99.7 /100 | #59 | Exceptional 4.9% |
| Immigrants | Middle Africa | 99.7 /100 | #60 | Exceptional 4.9% |
| Northern Europeans | 99.7 /100 | #61 | Exceptional 4.9% |
| Latvians | 99.6 /100 | #62 | Exceptional 4.9% |
| Croatians | 99.6 /100 | #63 | Exceptional 4.9% |
| Immigrants | Cambodia | 99.6 /100 | #64 | Exceptional 4.9% |
| Immigrants | Nicaragua | 99.6 /100 | #65 | Exceptional 4.9% |
| English | 99.5 /100 | #66 | Exceptional 4.9% |
| Iroquois | 99.5 /100 | #67 | Exceptional 4.9% |
| Bolivians | 99.5 /100 | #68 | Exceptional 4.9% |
| Scottish | 99.5 /100 | #69 | Exceptional 4.9% |