Immigrants from Belarus vs Soviet Union Unemployment Among Ages 60 to 64 years
COMPARE
Immigrants from Belarus
Soviet Union
Unemployment Among Ages 60 to 64 years
Unemployment Among Ages 60 to 64 years Comparison
Immigrants from Belarus
Soviet Union
5.0%
UNEMPLOYMENT AMONG AGES 60 TO 64 YEARS
6.4/ 100
METRIC RATING
228th/ 347
METRIC RANK
5.4%
UNEMPLOYMENT AMONG AGES 60 TO 64 YEARS
0.0/ 100
METRIC RATING
309th/ 347
METRIC RANK
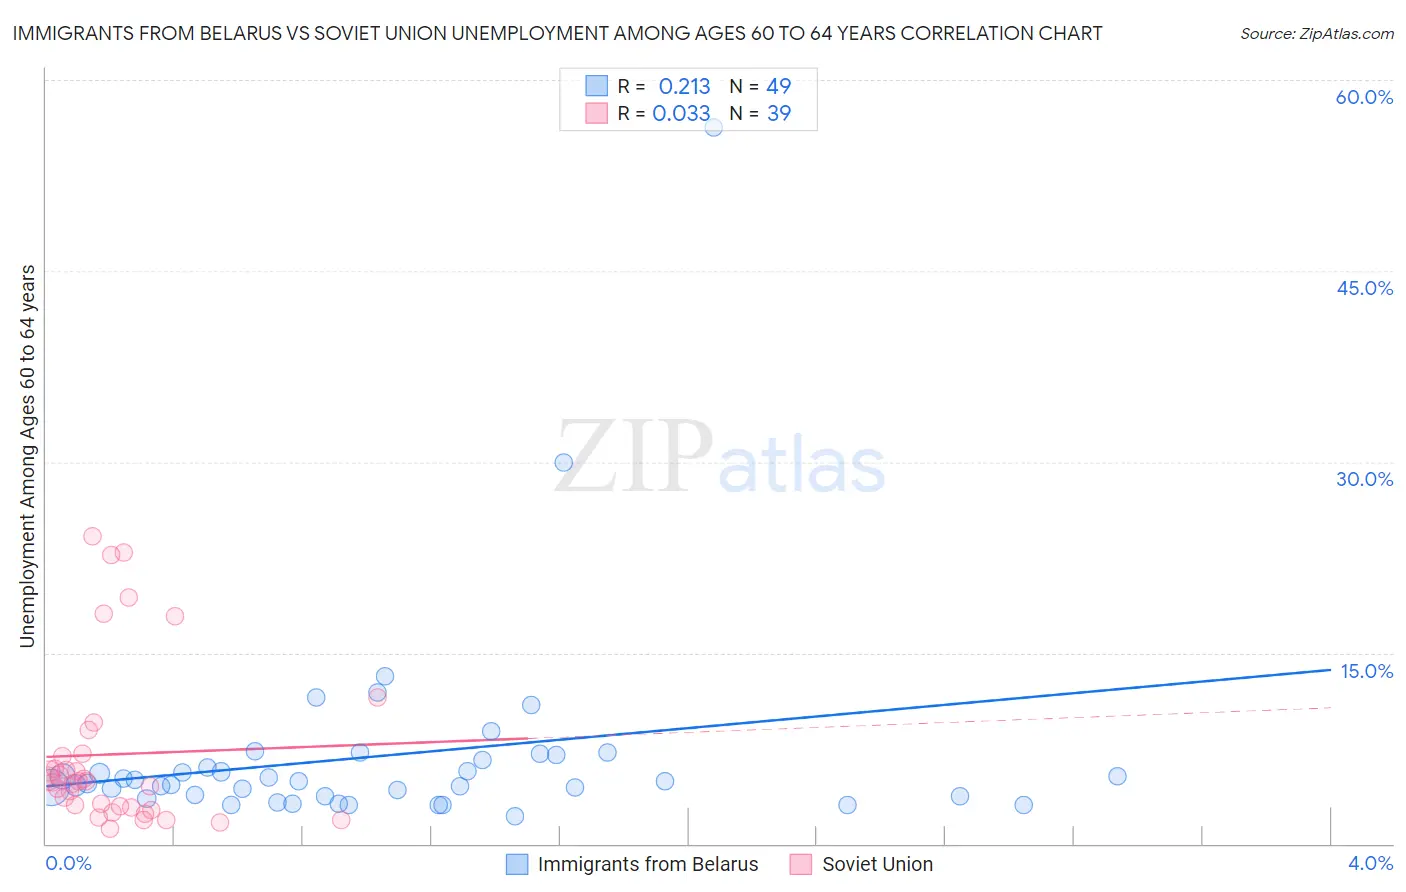
Immigrants from Belarus vs Soviet Union Unemployment Among Ages 60 to 64 years Correlation Chart
The statistical analysis conducted on geographies consisting of 144,606,203 people shows a weak positive correlation between the proportion of Immigrants from Belarus and unemployment rate among population between the ages 60 and 64 in the United States with a correlation coefficient (R) of 0.213 and weighted average of 5.0%. Similarly, the statistical analysis conducted on geographies consisting of 43,137,062 people shows no correlation between the proportion of Soviet Union and unemployment rate among population between the ages 60 and 64 in the United States with a correlation coefficient (R) of 0.033 and weighted average of 5.4%, a difference of 8.8%.
Unemployment Among Ages 60 to 64 years Correlation Summary
| Measurement | Immigrants from Belarus | Soviet Union |
| Minimum | 2.2% | 1.2% |
| Maximum | 56.3% | 24.2% |
| Range | 54.1% | 23.0% |
| Mean | 6.9% | 7.0% |
| Median | 4.9% | 4.9% |
| Interquartile 25% (IQ1) | 3.7% | 2.8% |
| Interquartile 75% (IQ3) | 6.8% | 7.0% |
| Interquartile Range (IQR) | 3.0% | 4.2% |
| Standard Deviation (Sample) | 8.4% | 6.4% |
| Standard Deviation (Population) | 8.3% | 6.4% |
Similar Demographics by Unemployment Among Ages 60 to 64 years
Demographics Similar to Immigrants from Belarus by Unemployment Among Ages 60 to 64 years
In terms of unemployment among ages 60 to 64 years, the demographic groups most similar to Immigrants from Belarus are Nigerian (5.0%, a difference of 0.050%), Immigrants from Chile (5.0%, a difference of 0.060%), African (5.0%, a difference of 0.070%), Immigrants from Denmark (5.0%, a difference of 0.10%), and Tohono O'odham (5.0%, a difference of 0.10%).
| Demographics | Rating | Rank | Unemployment Among Ages 60 to 64 years |
| Ugandans | 10.5 /100 | #221 | Poor 4.9% |
| Brazilians | 10.1 /100 | #222 | Poor 5.0% |
| Crow | 9.7 /100 | #223 | Tragic 5.0% |
| Immigrants | Cameroon | 8.5 /100 | #224 | Tragic 5.0% |
| Immigrants | Ireland | 7.2 /100 | #225 | Tragic 5.0% |
| Immigrants | Chile | 6.8 /100 | #226 | Tragic 5.0% |
| Nigerians | 6.8 /100 | #227 | Tragic 5.0% |
| Immigrants | Belarus | 6.4 /100 | #228 | Tragic 5.0% |
| Africans | 5.9 /100 | #229 | Tragic 5.0% |
| Immigrants | Denmark | 5.8 /100 | #230 | Tragic 5.0% |
| Tohono O'odham | 5.7 /100 | #231 | Tragic 5.0% |
| Immigrants | Eastern Asia | 4.7 /100 | #232 | Tragic 5.0% |
| Immigrants | Greece | 4.6 /100 | #233 | Tragic 5.0% |
| Iranians | 4.2 /100 | #234 | Tragic 5.0% |
| Delaware | 3.6 /100 | #235 | Tragic 5.0% |
Demographics Similar to Soviet Union by Unemployment Among Ages 60 to 64 years
In terms of unemployment among ages 60 to 64 years, the demographic groups most similar to Soviet Union are Spanish American Indian (5.4%, a difference of 0.010%), Immigrants from Guyana (5.4%, a difference of 0.020%), Immigrants from Dominica (5.4%, a difference of 0.19%), Cypriot (5.4%, a difference of 0.26%), and Immigrants from Mexico (5.4%, a difference of 0.28%).
| Demographics | Rating | Rank | Unemployment Among Ages 60 to 64 years |
| Barbadians | 0.0 /100 | #302 | Tragic 5.4% |
| Bahamians | 0.0 /100 | #303 | Tragic 5.4% |
| Immigrants | Mexico | 0.0 /100 | #304 | Tragic 5.4% |
| Cypriots | 0.0 /100 | #305 | Tragic 5.4% |
| Immigrants | Dominica | 0.0 /100 | #306 | Tragic 5.4% |
| Immigrants | Guyana | 0.0 /100 | #307 | Tragic 5.4% |
| Spanish American Indians | 0.0 /100 | #308 | Tragic 5.4% |
| Soviet Union | 0.0 /100 | #309 | Tragic 5.4% |
| British West Indians | 0.0 /100 | #310 | Tragic 5.5% |
| U.S. Virgin Islanders | 0.0 /100 | #311 | Tragic 5.5% |
| Immigrants | West Indies | 0.0 /100 | #312 | Tragic 5.5% |
| Belizeans | 0.0 /100 | #313 | Tragic 5.5% |
| Guyanese | 0.0 /100 | #314 | Tragic 5.5% |
| Cree | 0.0 /100 | #315 | Tragic 5.6% |
| Cheyenne | 0.0 /100 | #316 | Tragic 5.6% |