Immigrants from Trinidad and Tobago vs Immigrants from Iran Unemployment Among Ages 25 to 29 years
COMPARE
Immigrants from Trinidad and Tobago
Immigrants from Iran
Unemployment Among Ages 25 to 29 years
Unemployment Among Ages 25 to 29 years Comparison
Immigrants from Trinidad and Tobago
Immigrants from Iran
7.9%
UNEMPLOYMENT AMONG AGES 25 TO 29 YEARS
0.0/ 100
METRIC RATING
298th/ 347
METRIC RANK
6.7%
UNEMPLOYMENT AMONG AGES 25 TO 29 YEARS
34.4/ 100
METRIC RATING
186th/ 347
METRIC RANK
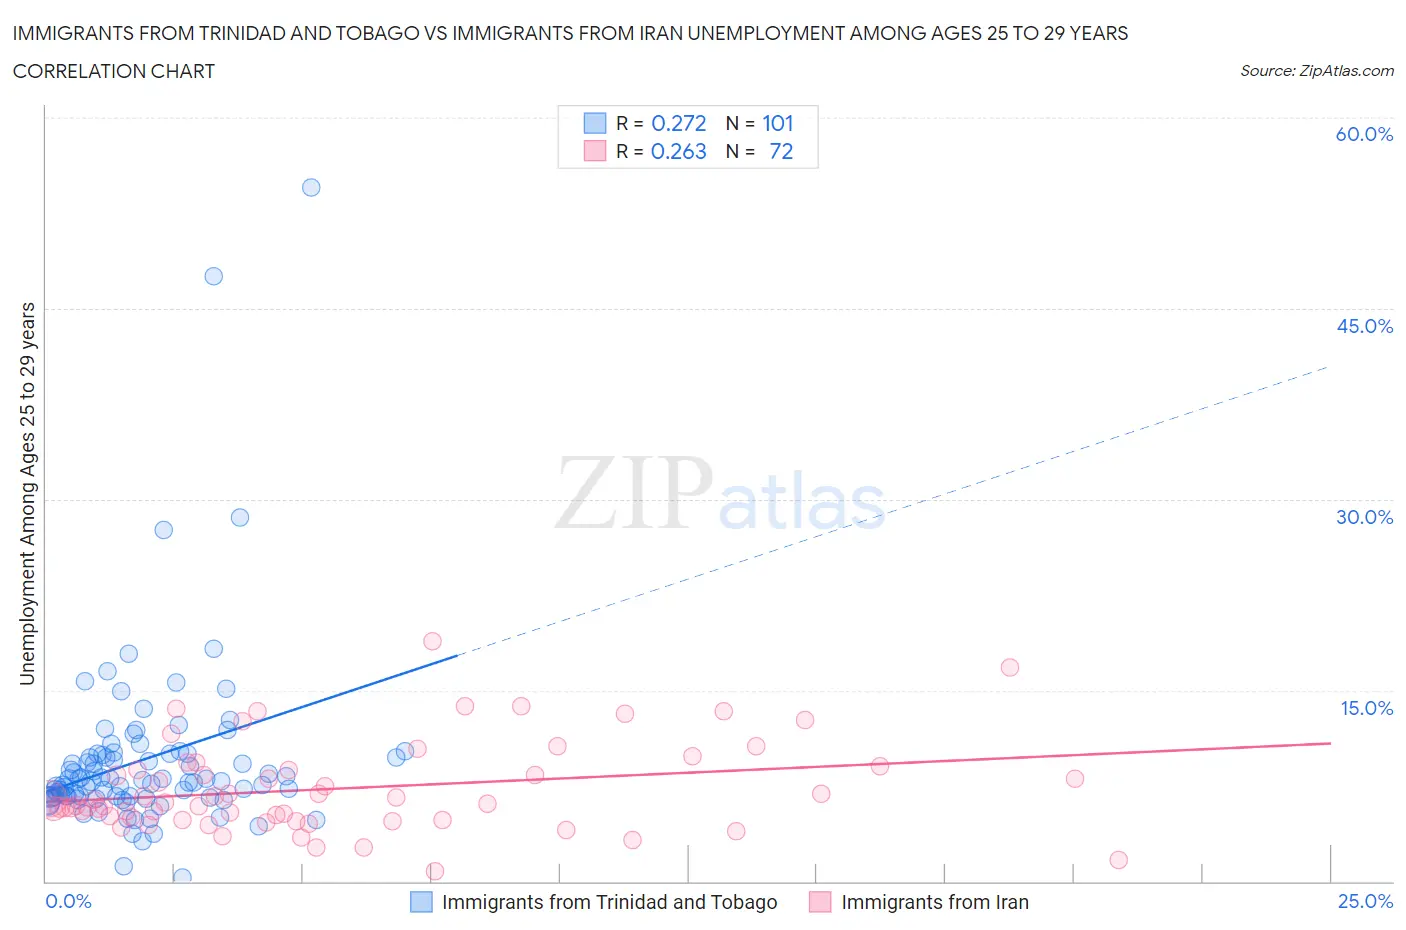
Immigrants from Trinidad and Tobago vs Immigrants from Iran Unemployment Among Ages 25 to 29 years Correlation Chart
The statistical analysis conducted on geographies consisting of 217,670,248 people shows a weak positive correlation between the proportion of Immigrants from Trinidad and Tobago and unemployment rate among population between the ages 25 and 29 in the United States with a correlation coefficient (R) of 0.272 and weighted average of 7.9%. Similarly, the statistical analysis conducted on geographies consisting of 271,354,448 people shows a weak positive correlation between the proportion of Immigrants from Iran and unemployment rate among population between the ages 25 and 29 in the United States with a correlation coefficient (R) of 0.263 and weighted average of 6.7%, a difference of 17.5%.
Unemployment Among Ages 25 to 29 years Correlation Summary
| Measurement | Immigrants from Trinidad and Tobago | Immigrants from Iran |
| Minimum | 0.30% | 0.80% |
| Maximum | 54.5% | 18.9% |
| Range | 54.2% | 18.1% |
| Mean | 9.6% | 7.3% |
| Median | 7.9% | 6.1% |
| Interquartile 25% (IQ1) | 6.6% | 4.9% |
| Interquartile 75% (IQ3) | 10.0% | 8.9% |
| Interquartile Range (IQR) | 3.4% | 4.0% |
| Standard Deviation (Sample) | 7.3% | 3.5% |
| Standard Deviation (Population) | 7.2% | 3.5% |
Similar Demographics by Unemployment Among Ages 25 to 29 years
Demographics Similar to Immigrants from Trinidad and Tobago by Unemployment Among Ages 25 to 29 years
In terms of unemployment among ages 25 to 29 years, the demographic groups most similar to Immigrants from Trinidad and Tobago are Barbadian (7.9%, a difference of 0.18%), Central American Indian (7.9%, a difference of 0.19%), West Indian (7.9%, a difference of 0.22%), Blackfeet (7.9%, a difference of 0.26%), and Jamaican (7.9%, a difference of 0.38%).
| Demographics | Rating | Rank | Unemployment Among Ages 25 to 29 years |
| Hispanics or Latinos | 0.0 /100 | #291 | Tragic 7.7% |
| Chippewa | 0.0 /100 | #292 | Tragic 7.8% |
| Immigrants | Belize | 0.0 /100 | #293 | Tragic 7.8% |
| Trinidadians and Tobagonians | 0.0 /100 | #294 | Tragic 7.8% |
| Comanche | 0.0 /100 | #295 | Tragic 7.8% |
| Immigrants | West Indies | 0.0 /100 | #296 | Tragic 7.8% |
| Blackfeet | 0.0 /100 | #297 | Tragic 7.9% |
| Immigrants | Trinidad and Tobago | 0.0 /100 | #298 | Tragic 7.9% |
| Barbadians | 0.0 /100 | #299 | Tragic 7.9% |
| Central American Indians | 0.0 /100 | #300 | Tragic 7.9% |
| West Indians | 0.0 /100 | #301 | Tragic 7.9% |
| Jamaicans | 0.0 /100 | #302 | Tragic 7.9% |
| Immigrants | Yemen | 0.0 /100 | #303 | Tragic 8.0% |
| Cajuns | 0.0 /100 | #304 | Tragic 8.0% |
| Tsimshian | 0.0 /100 | #305 | Tragic 8.0% |
Demographics Similar to Immigrants from Iran by Unemployment Among Ages 25 to 29 years
In terms of unemployment among ages 25 to 29 years, the demographic groups most similar to Immigrants from Iran are Immigrants from South America (6.7%, a difference of 0.090%), Moroccan (6.7%, a difference of 0.10%), Irish (6.7%, a difference of 0.11%), Argentinean (6.7%, a difference of 0.16%), and Immigrants from Costa Rica (6.7%, a difference of 0.26%).
| Demographics | Rating | Rank | Unemployment Among Ages 25 to 29 years |
| Costa Ricans | 44.9 /100 | #179 | Average 6.7% |
| Immigrants | Africa | 41.1 /100 | #180 | Average 6.7% |
| Immigrants | Western Europe | 41.1 /100 | #181 | Average 6.7% |
| Czechoslovakians | 40.7 /100 | #182 | Average 6.7% |
| Immigrants | Scotland | 39.6 /100 | #183 | Fair 6.7% |
| Immigrants | Costa Rica | 38.3 /100 | #184 | Fair 6.7% |
| Moroccans | 35.9 /100 | #185 | Fair 6.7% |
| Immigrants | Iran | 34.4 /100 | #186 | Fair 6.7% |
| Immigrants | South America | 33.0 /100 | #187 | Fair 6.7% |
| Irish | 32.8 /100 | #188 | Fair 6.7% |
| Argentineans | 32.1 /100 | #189 | Fair 6.7% |
| Koreans | 29.3 /100 | #190 | Fair 6.7% |
| Chickasaw | 28.7 /100 | #191 | Fair 6.7% |
| Immigrants | Ukraine | 28.6 /100 | #192 | Fair 6.7% |
| Alsatians | 28.1 /100 | #193 | Fair 6.7% |