Immigrants from Trinidad and Tobago vs Colville Unemployment Among Ages 25 to 29 years

COMPARE

Immigrants from Trinidad and Tobago
Race
Ancestry
AfghanAfricanAlaska NativeAlaskan AthabascanAlbanianAleutAlsatianAmericanApacheArabArapahoArgentineanArmenianAssyrian/Chaldean/SyriacAustralianAustrianBahamianBangladeshiBarbadianBasqueBelgianBelizeanBermudanBhutaneseBlackfeetBolivianBrazilianBritishBritish West IndianBulgarianBurmeseCajunCambodianCanadianCape VerdeanCarpatho RusynCelticCentral AmericanCentral American IndianCherokeeCheyenneChickasawChileanChineseChippewaChoctawColombianComancheCosta RicanCreeCreekCroatianCrowCubanCypriotCzechCzechoslovakianDanishDelawareDominicanDutchDutch West IndianEastern EuropeanEcuadorianEgyptianEnglishEstonianEthiopianEuropeanFijianFilipinoFinnishFrenchFrench American IndianFrench CanadianGermanGerman RussianGhanaianGreekGuamanian/ChamorroGuatemalanGuyaneseHaitianHmongHonduranHopiHoumaHungarianIcelanderIndian (Asian)IndonesianInupiatIranianIraqiIrishIroquoisIsraeliItalianJamaicanJapaneseJordanianKenyanKiowaKoreanLaotianLatvianLebaneseLiberianLithuanianLumbeeLuxembourgerMacedonianMalaysianMalteseMarshalleseMenomineeMexicanMexican American IndianMongolianMoroccanNative HawaiianNavajoNepaleseNew ZealanderNicaraguanNigerianNorthern EuropeanNorwegianOkinawanOsageOttawaPaiutePakistaniPalestinianPanamanianParaguayanPennsylvania GermanPeruvianPimaPolishPortuguesePotawatomiPuebloPuerto RicanPuget Sound SalishRomanianRussianSalvadoranSamoanScandinavianScotch-IrishScottishSeminoleSenegaleseSerbianShoshoneSierra LeoneanSiouxSlavicSlovakSloveneSomaliSouth AfricanSouth AmericanSouth American IndianSoviet UnionSpaniardSpanishSpanish AmericanSpanish American IndianSri LankanSubsaharan AfricanSudaneseSwedishSwissSyrianTaiwaneseThaiTlingit-HaidaTohono O'OdhamTonganTrinidadian and TobagonianTsimshianTurkishU.S. Virgin IslanderUgandanUkrainianUruguayanUteVenezuelanVietnameseWelshWest IndianYakamaYaquiYugoslavianYumanYup'ikZimbabwean
Immigration
NonimmigrantsImmigrantsAfghanistanAfricaAlbaniaArgentinaArmeniaAsiaAustraliaAustriaBahamasBangladeshBarbadosBelarusBelgiumBelizeBoliviaBosnia and HerzegovinaBrazilBulgariaBurma/MyanmarCabo VerdeCambodiaCameroonCanadaCaribbeanCentral AmericaChileChinaColombiaCongoCosta RicaCroatiaCubaCzechoslovakiaDenmarkDominicaDominican RepublicEastern AfricaEastern AsiaEastern EuropeEcuadorEgyptEl SalvadorEnglandEritreaEthiopiaEuropeFijiFranceGermanyGhanaGreeceGrenadaGuatemalaGuyanaHaitiHondurasHong KongHungaryIndiaIndonesiaIranIraqIrelandIsraelItalyJamaicaJapanJordanKazakhstanKenyaKoreaKuwaitLaosLatin AmericaLatviaLebanonLiberiaLithuaniaMalaysiaMexicoMicronesiaMiddle AfricaMoldovaMoroccoNepalNetherlandsNicaraguaNigeriaNorth AmericaNorth MacedoniaNorthern AfricaNorthern EuropeNorwayOceaniaPakistanPanamaPeruPhilippinesPolandPortugalRomaniaRussiaSaudi ArabiaScotlandSenegalSerbiaSierra LeoneSingaporeSomaliaSouth AfricaSouth AmericaSouth Central AsiaSouth Eastern AsiaSouthern EuropeSpainSri LankaSt. Vincent and the GrenadinesSudanSwedenSwitzerlandSyriaTaiwanThailandTrinidad and TobagoTurkeyUgandaUkraineUruguayUzbekistanVenezuelaVietnamWest IndiesWestern AfricaWestern AsiaWestern EuropeYemenZaireZimbabweAzores
Colville
Race
Ancestry
AfghanAfricanAlaska NativeAlaskan AthabascanAlbanianAleutAlsatianAmericanApacheArabArapahoArgentineanArmenianAssyrian/Chaldean/SyriacAustralianAustrianBahamianBangladeshiBarbadianBasqueBelgianBelizeanBermudanBhutaneseBlackfeetBolivianBrazilianBritishBritish West IndianBulgarianBurmeseCajunCambodianCanadianCape VerdeanCarpatho RusynCelticCentral AmericanCentral American IndianCherokeeCheyenneChickasawChileanChineseChippewaChoctawColombianColvilleComancheCosta RicanCreeCreekCroatianCrowCubanCypriotCzechCzechoslovakianDanishDelawareDominicanDutchDutch West IndianEastern EuropeanEcuadorianEgyptianEnglishEstonianEthiopianEuropeanFijianFilipinoFinnishFrenchFrench American IndianFrench CanadianGermanGerman RussianGhanaianGreekGuamanian/ChamorroGuatemalanGuyaneseHaitianHmongHonduranHopiHoumaHungarianIcelanderIndian (Asian)IndonesianInupiatIranianIraqiIrishIroquoisIsraeliItalianJamaicanJapaneseJordanianKenyanKiowaKoreanLaotianLatvianLebaneseLiberianLithuanianLumbeeLuxembourgerMacedonianMalaysianMalteseMarshalleseMenomineeMexicanMexican American IndianMongolianMoroccanNative HawaiianNavajoNepaleseNew ZealanderNicaraguanNigerianNorthern EuropeanNorwegianOkinawanOsageOttawaPaiutePakistaniPalestinianPanamanianParaguayanPennsylvania GermanPeruvianPimaPolishPortuguesePotawatomiPuebloPuerto RicanPuget Sound SalishRomanianRussianSalvadoranSamoanScandinavianScotch-IrishScottishSeminoleSenegaleseSerbianShoshoneSierra LeoneanSiouxSlavicSlovakSloveneSomaliSouth AfricanSouth AmericanSouth American IndianSoviet UnionSpaniardSpanishSpanish AmericanSpanish American IndianSri LankanSubsaharan AfricanSudaneseSwedishSwissSyrianTaiwaneseThaiTlingit-HaidaTohono O'OdhamTonganTrinidadian and TobagonianTsimshianTurkishU.S. Virgin IslanderUgandanUkrainianUruguayanUteVenezuelanVietnameseWelshWest IndianYakamaYaquiYugoslavianYumanYup'ikZimbabwean
Immigration
NonimmigrantsImmigrantsAfghanistanAfricaAlbaniaArgentinaArmeniaAsiaAustraliaAustriaBahamasBangladeshBarbadosBelarusBelgiumBelizeBoliviaBosnia and HerzegovinaBrazilBulgariaBurma/MyanmarCabo VerdeCambodiaCameroonCanadaCaribbeanCentral AmericaChileChinaColombiaCongoCosta RicaCroatiaCubaCzechoslovakiaDenmarkDominicaDominican RepublicEastern AfricaEastern AsiaEastern EuropeEcuadorEgyptEl SalvadorEnglandEritreaEthiopiaEuropeFijiFranceGermanyGhanaGreeceGrenadaGuatemalaGuyanaHaitiHondurasHong KongHungaryIndiaIndonesiaIranIraqIrelandIsraelItalyJamaicaJapanJordanKazakhstanKenyaKoreaKuwaitLaosLatin AmericaLatviaLebanonLiberiaLithuaniaMalaysiaMexicoMicronesiaMiddle AfricaMoldovaMoroccoNepalNetherlandsNicaraguaNigeriaNorth AmericaNorth MacedoniaNorthern AfricaNorthern EuropeNorwayOceaniaPakistanPanamaPeruPhilippinesPolandPortugalRomaniaRussiaSaudi ArabiaScotlandSenegalSerbiaSierra LeoneSingaporeSomaliaSouth AfricaSouth AmericaSouth Central AsiaSouth Eastern AsiaSouthern EuropeSpainSri LankaSt. Vincent and the GrenadinesSudanSwedenSwitzerlandSyriaTaiwanThailandTurkeyUgandaUkraineUruguayUzbekistanVenezuelaVietnamWest IndiesWestern AfricaWestern AsiaWestern EuropeYemenZaireZimbabweAzores
Unemployment Among Ages 25 to 29 years
Income
Poverty
Unemployment
Labor Participation
Family Structure
Vehicle Availability
Education Level
Disability

Unemployment Among Ages 25 to 29 years Comparison

Immigrants from Trinidad and Tobago

Colville

Tragic
Tragic
7.9%
UNEMPLOYMENT AMONG AGES 25 TO 29 YEARS
0.0/ 100
METRIC RATING
298th/ 347
METRIC RANK
9.2%
UNEMPLOYMENT AMONG AGES 25 TO 29 YEARS
0.0/ 100
METRIC RATING
327th/ 347
METRIC RANK

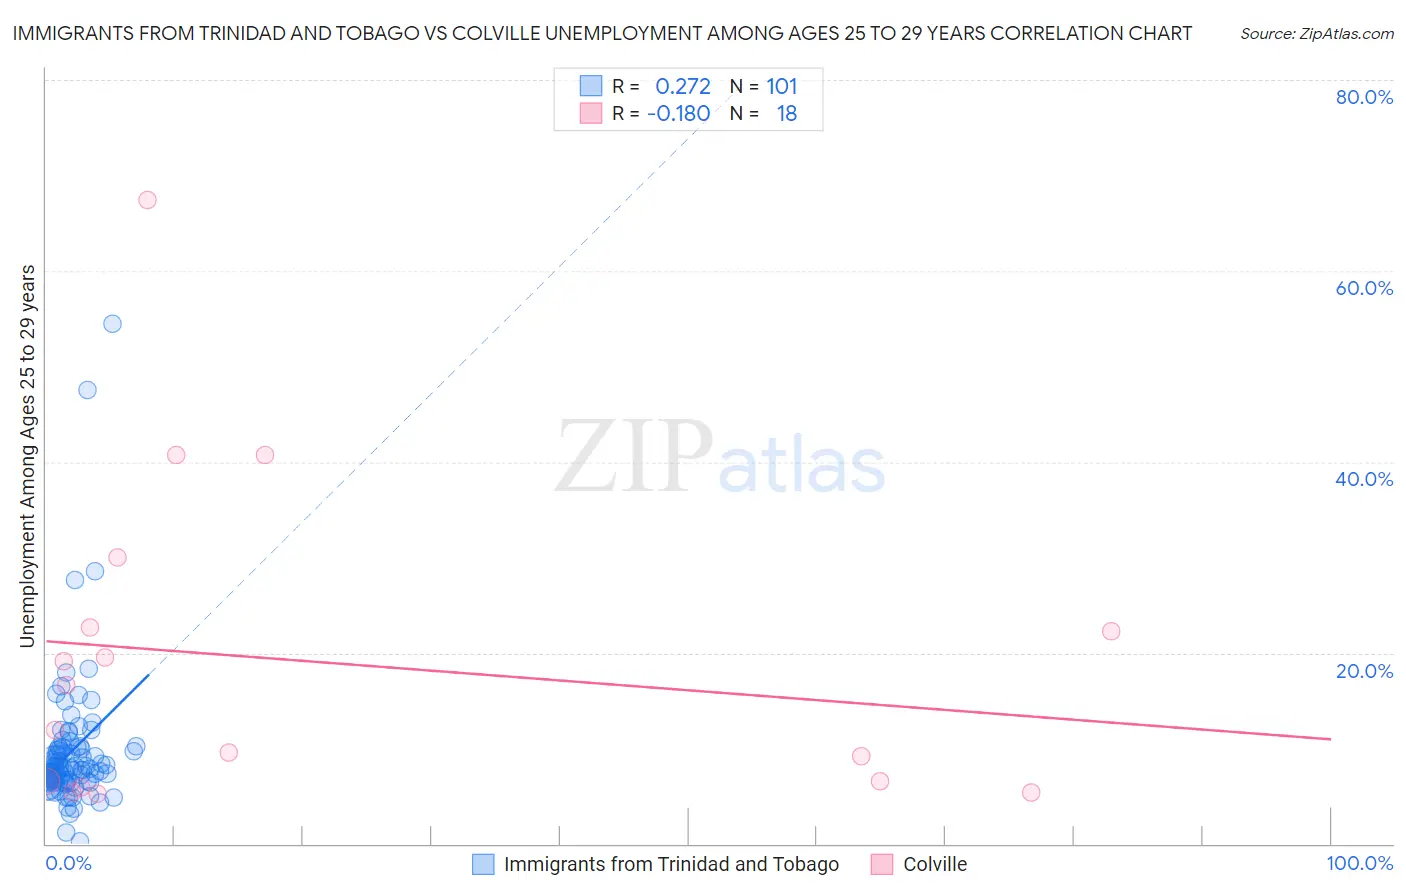
Immigrants from Trinidad and Tobago vs Colville Unemployment Among Ages 25 to 29 years Correlation Chart

The statistical analysis conducted on geographies consisting of 217,670,248 people shows a weak positive correlation between the proportion of Immigrants from Trinidad and Tobago and unemployment rate among population between the ages 25 and 29 in the United States with a correlation coefficient (R) of 0.272 and weighted average of 7.9%. Similarly, the statistical analysis conducted on geographies consisting of 34,069,511 people shows a poor negative correlation between the proportion of Colville and unemployment rate among population between the ages 25 and 29 in the United States with a correlation coefficient (R) of -0.180 and weighted average of 9.2%, a difference of 17.2%.
Immigrants from Trinidad and Tobago vs Colville Unemployment Among Ages 25 to 29 years

Unemployment Among Ages 25 to 29 years Correlation Summary

MeasurementImmigrants from Trinidad and TobagoColville
Minimum0.30%5.3%
Maximum54.5%67.4%
Range54.2%62.1%
Mean9.6%19.1%
Median7.9%14.3%
Interquartile 25% (IQ1)6.6%6.5%
Interquartile 75% (IQ3)10.0%22.7%
Interquartile Range (IQR)3.4%16.2%
Standard Deviation (Sample)7.3%16.6%
Standard Deviation (Population)7.2%16.2%

Similar Demographics by Unemployment Among Ages 25 to 29 years

Demographics Similar to Immigrants from Trinidad and Tobago by Unemployment Among Ages 25 to 29 years

In terms of unemployment among ages 25 to 29 years, the demographic groups most similar to Immigrants from Trinidad and Tobago are Barbadian (7.9%, a difference of 0.18%), Central American Indian (7.9%, a difference of 0.19%), West Indian (7.9%, a difference of 0.22%), Blackfeet (7.9%, a difference of 0.26%), and Jamaican (7.9%, a difference of 0.38%).
DemographicsRating | RankUnemployment Among Ages 25 to 29 years
Hispanics or Latinos
0.0
/100
|
#291
Tragic
7.7%
Chippewa
0.0
/100
|
#292
Tragic
7.8%
Immigrants | Belize
0.0
/100
|
#293
Tragic
7.8%
Trinidadians and Tobagonians
0.0
/100
|
#294
Tragic
7.8%
Comanche
0.0
/100
|
#295
Tragic
7.8%
Immigrants | West Indies
0.0
/100
|
#296
Tragic
7.8%
Blackfeet
0.0
/100
|
#297
Tragic
7.9%
Immigrants | Trinidad and Tobago
0.0
/100
|
#298
Tragic
7.9%
Barbadians
0.0
/100
|
#299
Tragic
7.9%
Central American Indians
0.0
/100
|
#300
Tragic
7.9%
West Indians
0.0
/100
|
#301
Tragic
7.9%
Jamaicans
0.0
/100
|
#302
Tragic
7.9%
Immigrants | Yemen
0.0
/100
|
#303
Tragic
8.0%
Cajuns
0.0
/100
|
#304
Tragic
8.0%
Tsimshian
0.0
/100
|
#305
Tragic
8.0%

Demographics Similar to Colville by Unemployment Among Ages 25 to 29 years

In terms of unemployment among ages 25 to 29 years, the demographic groups most similar to Colville are Shoshone (9.2%, a difference of 0.16%), Apache (9.5%, a difference of 2.6%), Aleut (9.7%, a difference of 4.9%), Yakama (8.8%, a difference of 5.5%), and Houma (8.7%, a difference of 6.0%).
DemographicsRating | RankUnemployment Among Ages 25 to 29 years
Blacks/African Americans
0.0
/100
|
#320
Tragic
8.6%
Immigrants | Dominican Republic
0.0
/100
|
#321
Tragic
8.6%
Tlingit-Haida
0.0
/100
|
#322
Tragic
8.7%
Dominicans
0.0
/100
|
#323
Tragic
8.7%
Houma
0.0
/100
|
#324
Tragic
8.7%
Yakama
0.0
/100
|
#325
Tragic
8.8%
Shoshone
0.0
/100
|
#326
Tragic
9.2%
Colville
0.0
/100
|
#327
Tragic
9.2%
Apache
0.0
/100
|
#328
Tragic
9.5%
Aleuts
0.0
/100
|
#329
Tragic
9.7%
Natives/Alaskans
0.0
/100
|
#330
Tragic
9.8%
Alaska Natives
0.0
/100
|
#331
Tragic
10.2%
Pueblo
0.0
/100
|
#332
Tragic
10.4%
Alaskan Athabascans
0.0
/100
|
#333
Tragic
10.8%
Yuman
0.0
/100
|
#334
Tragic
11.0%