German vs European Unemployment Among Ages 16 to 19 years
COMPARE
German
European
Unemployment Among Ages 16 to 19 years
Unemployment Among Ages 16 to 19 years Comparison
Germans
Europeans
15.7%
UNEMPLOYMENT AMONG AGES 16 TO 19 YEARS
100.0/ 100
METRIC RATING
16th/ 347
METRIC RANK
16.1%
UNEMPLOYMENT AMONG AGES 16 TO 19 YEARS
99.9/ 100
METRIC RATING
32nd/ 347
METRIC RANK
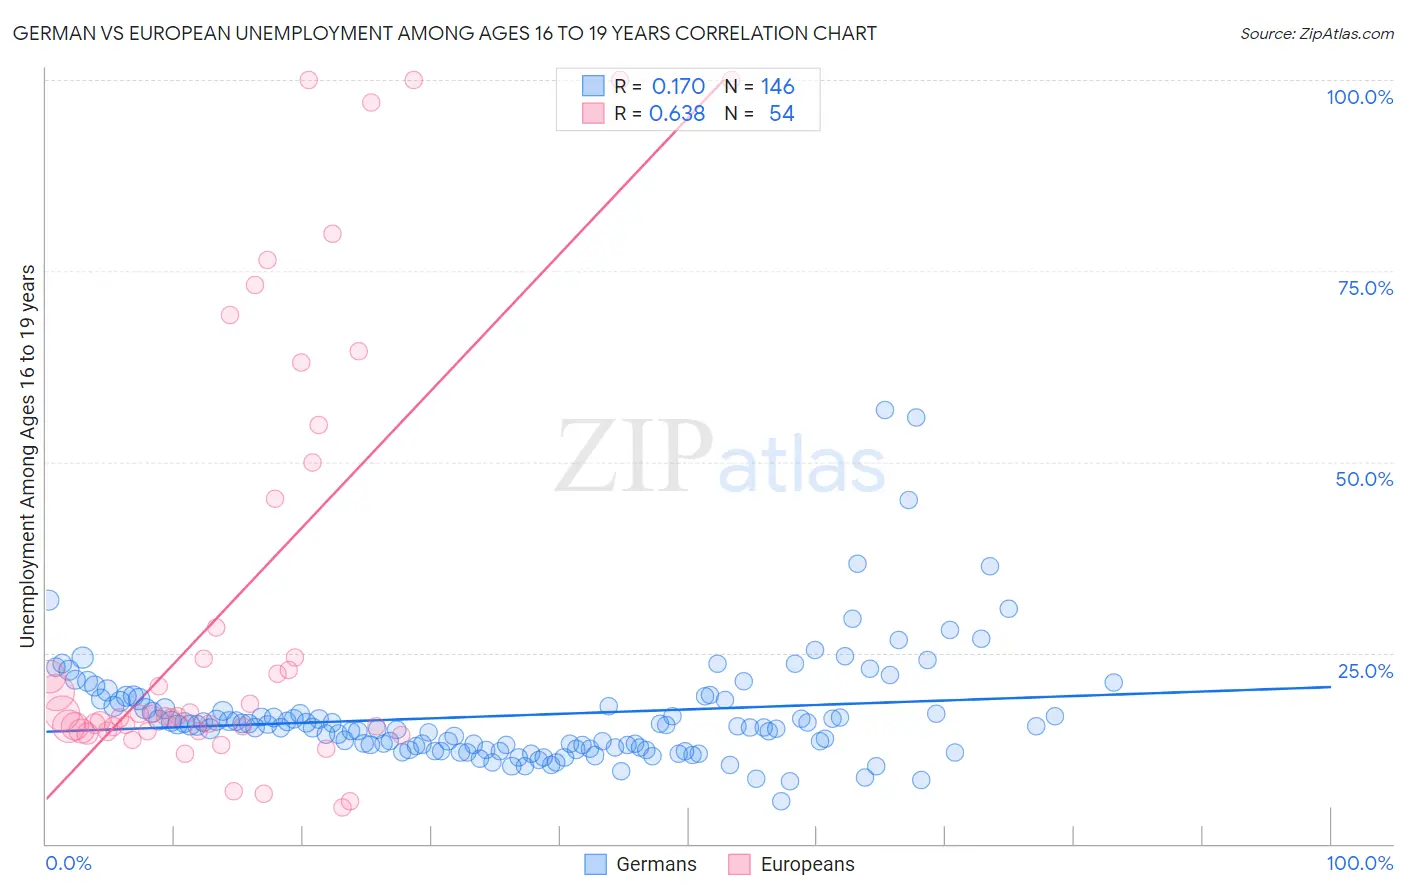
German vs European Unemployment Among Ages 16 to 19 years Correlation Chart
The statistical analysis conducted on geographies consisting of 512,682,712 people shows a poor positive correlation between the proportion of Germans and unemployment rate among population between the ages 16 and 19 in the United States with a correlation coefficient (R) of 0.170 and weighted average of 15.7%. Similarly, the statistical analysis conducted on geographies consisting of 503,228,769 people shows a significant positive correlation between the proportion of Europeans and unemployment rate among population between the ages 16 and 19 in the United States with a correlation coefficient (R) of 0.638 and weighted average of 16.1%, a difference of 2.9%.
Unemployment Among Ages 16 to 19 years Correlation Summary
| Measurement | German | European |
| Minimum | 5.6% | 4.8% |
| Maximum | 56.8% | 100.0% |
| Range | 51.2% | 95.2% |
| Mean | 16.8% | 31.7% |
| Median | 15.4% | 16.9% |
| Interquartile 25% (IQ1) | 12.4% | 14.8% |
| Interquartile 75% (IQ3) | 18.0% | 45.1% |
| Interquartile Range (IQR) | 5.6% | 30.3% |
| Standard Deviation (Sample) | 7.4% | 28.9% |
| Standard Deviation (Population) | 7.4% | 28.6% |
Demographics Similar to Germans and Europeans by Unemployment Among Ages 16 to 19 years
In terms of unemployment among ages 16 to 19 years, the demographic groups most similar to Germans are Somali (15.7%, a difference of 0.21%), Yugoslavian (15.6%, a difference of 0.29%), Immigrants from Zaire (15.6%, a difference of 0.34%), Thai (15.7%, a difference of 0.45%), and Swiss (15.8%, a difference of 0.56%). Similarly, the demographic groups most similar to Europeans are English (16.1%, a difference of 0.39%), Kenyan (16.1%, a difference of 0.45%), Chinese (16.0%, a difference of 0.48%), Immigrants from Kenya (16.2%, a difference of 0.51%), and Jordanian (16.0%, a difference of 0.54%).
| Demographics | Rating | Rank | Unemployment Among Ages 16 to 19 years |
| Immigrants | Zaire | 100.0 /100 | #14 | Exceptional 15.6% |
| Yugoslavians | 100.0 /100 | #15 | Exceptional 15.6% |
| Germans | 100.0 /100 | #16 | Exceptional 15.7% |
| Somalis | 100.0 /100 | #17 | Exceptional 15.7% |
| Thais | 100.0 /100 | #18 | Exceptional 15.7% |
| Swiss | 100.0 /100 | #19 | Exceptional 15.8% |
| Sudanese | 100.0 /100 | #20 | Exceptional 15.8% |
| Immigrants | Taiwan | 100.0 /100 | #21 | Exceptional 15.8% |
| Finns | 100.0 /100 | #22 | Exceptional 15.9% |
| Belgians | 100.0 /100 | #23 | Exceptional 15.9% |
| Tongans | 100.0 /100 | #24 | Exceptional 15.9% |
| Filipinos | 100.0 /100 | #25 | Exceptional 15.9% |
| Dutch | 100.0 /100 | #26 | Exceptional 15.9% |
| Immigrants | Sudan | 99.9 /100 | #27 | Exceptional 16.0% |
| Jordanians | 99.9 /100 | #28 | Exceptional 16.0% |
| Chinese | 99.9 /100 | #29 | Exceptional 16.0% |
| Kenyans | 99.9 /100 | #30 | Exceptional 16.1% |
| English | 99.9 /100 | #31 | Exceptional 16.1% |
| Europeans | 99.9 /100 | #32 | Exceptional 16.1% |
| Immigrants | Kenya | 99.9 /100 | #33 | Exceptional 16.2% |
| Pennsylvania Germans | 99.9 /100 | #34 | Exceptional 16.2% |