Immigrants from Taiwan vs Estonian Unemployment Among Youth under 25 years
COMPARE
Immigrants from Taiwan
Estonian
Unemployment Among Youth under 25 years
Unemployment Among Youth under 25 years Comparison
Immigrants from Taiwan
Estonians
11.2%
UNEMPLOYMENT AMONG YOUTH UNDER 25 YEARS
95.1/ 100
METRIC RATING
91st/ 347
METRIC RANK
11.3%
UNEMPLOYMENT AMONG YOUTH UNDER 25 YEARS
94.2/ 100
METRIC RATING
98th/ 347
METRIC RANK
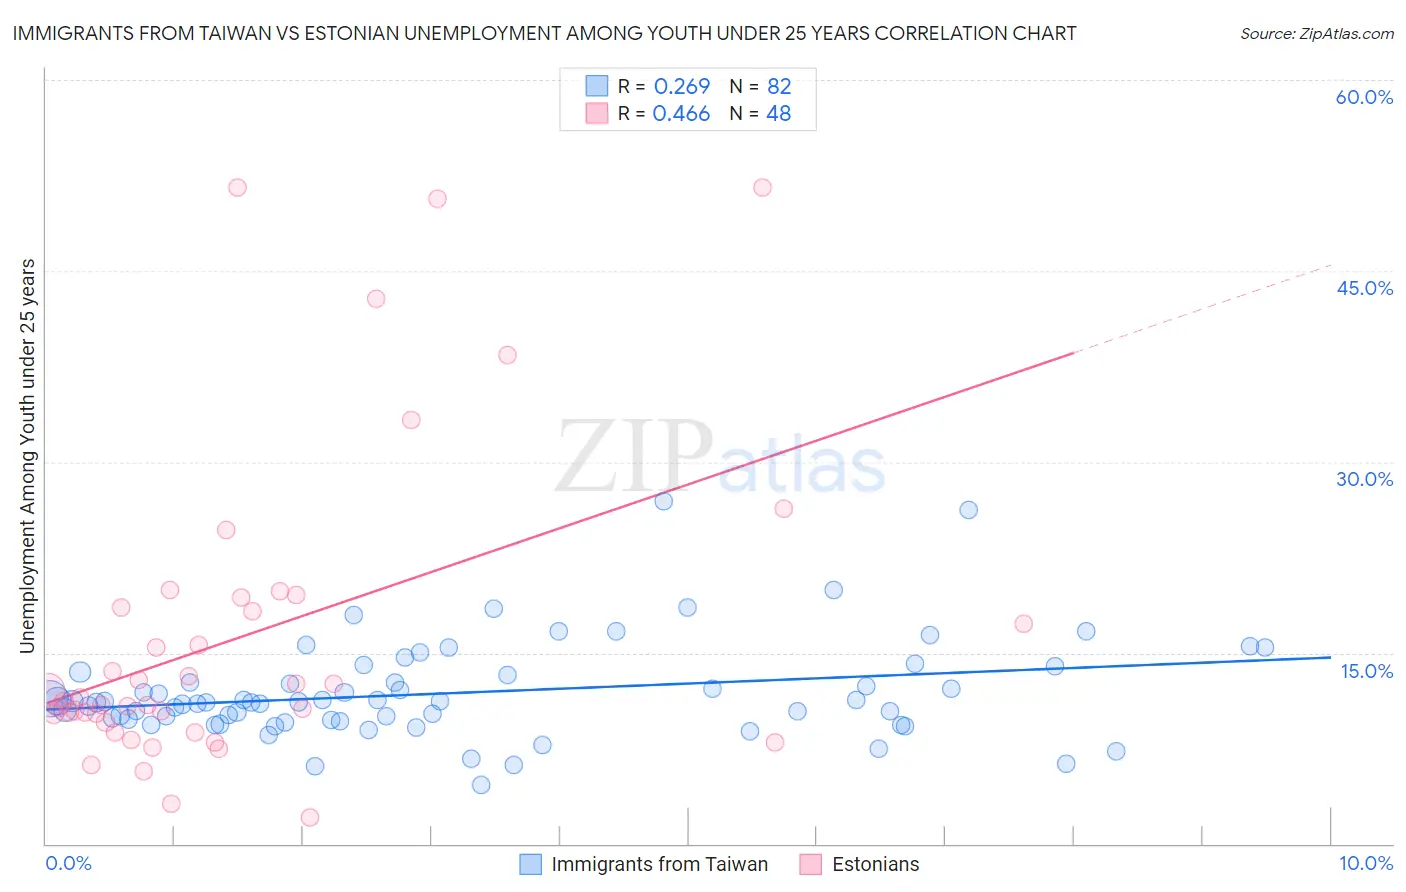
Immigrants from Taiwan vs Estonian Unemployment Among Youth under 25 years Correlation Chart
The statistical analysis conducted on geographies consisting of 296,148,481 people shows a weak positive correlation between the proportion of Immigrants from Taiwan and unemployment rate among youth under the age of 25 in the United States with a correlation coefficient (R) of 0.269 and weighted average of 11.2%. Similarly, the statistical analysis conducted on geographies consisting of 122,888,730 people shows a moderate positive correlation between the proportion of Estonians and unemployment rate among youth under the age of 25 in the United States with a correlation coefficient (R) of 0.466 and weighted average of 11.3%, a difference of 0.19%.
Unemployment Among Youth under 25 years Correlation Summary
| Measurement | Immigrants from Taiwan | Estonian |
| Minimum | 4.6% | 2.1% |
| Maximum | 26.9% | 51.6% |
| Range | 22.3% | 49.5% |
| Mean | 11.9% | 16.3% |
| Median | 11.1% | 11.4% |
| Interquartile 25% (IQ1) | 9.7% | 9.8% |
| Interquartile 75% (IQ3) | 13.3% | 18.9% |
| Interquartile Range (IQR) | 3.6% | 9.1% |
| Standard Deviation (Sample) | 3.8% | 12.2% |
| Standard Deviation (Population) | 3.8% | 12.1% |
Demographics Similar to Immigrants from Taiwan and Estonians by Unemployment Among Youth under 25 years
In terms of unemployment among youth under 25 years, the demographic groups most similar to Immigrants from Taiwan are Immigrants from Latvia (11.2%, a difference of 0.0%), Immigrants from North America (11.2%, a difference of 0.0%), Lithuanian (11.3%, a difference of 0.070%), Immigrants from Bolivia (11.2%, a difference of 0.080%), and Immigrants from Japan (11.2%, a difference of 0.090%). Similarly, the demographic groups most similar to Estonians are Nicaraguan (11.3%, a difference of 0.0%), Immigrants from Serbia (11.3%, a difference of 0.020%), Carpatho Rusyn (11.3%, a difference of 0.040%), Celtic (11.3%, a difference of 0.050%), and Pakistani (11.3%, a difference of 0.050%).
| Demographics | Rating | Rank | Unemployment Among Youth under 25 years |
| French Canadians | 95.9 /100 | #84 | Exceptional 11.2% |
| Immigrants | South Central Asia | 95.9 /100 | #85 | Exceptional 11.2% |
| Immigrants | South Africa | 95.8 /100 | #86 | Exceptional 11.2% |
| Kenyans | 95.7 /100 | #87 | Exceptional 11.2% |
| Austrians | 95.5 /100 | #88 | Exceptional 11.2% |
| Immigrants | Japan | 95.5 /100 | #89 | Exceptional 11.2% |
| Immigrants | Bolivia | 95.5 /100 | #90 | Exceptional 11.2% |
| Immigrants | Taiwan | 95.1 /100 | #91 | Exceptional 11.2% |
| Immigrants | Latvia | 95.1 /100 | #92 | Exceptional 11.2% |
| Immigrants | North America | 95.1 /100 | #93 | Exceptional 11.2% |
| Lithuanians | 94.8 /100 | #94 | Exceptional 11.3% |
| Carpatho Rusyns | 94.4 /100 | #95 | Exceptional 11.3% |
| Immigrants | Serbia | 94.4 /100 | #96 | Exceptional 11.3% |
| Nicaraguans | 94.3 /100 | #97 | Exceptional 11.3% |
| Estonians | 94.2 /100 | #98 | Exceptional 11.3% |
| Celtics | 94.0 /100 | #99 | Exceptional 11.3% |
| Pakistanis | 94.0 /100 | #100 | Exceptional 11.3% |
| Iroquois | 93.8 /100 | #101 | Exceptional 11.3% |
| Immigrants | Thailand | 93.6 /100 | #102 | Exceptional 11.3% |
| Immigrants | Malaysia | 93.6 /100 | #103 | Exceptional 11.3% |
| Immigrants | Afghanistan | 93.4 /100 | #104 | Exceptional 11.3% |