Immigrants from Mexico vs Paiute Unemployment Among Ages 55 to 59 years
COMPARE
Immigrants from Mexico
Paiute
Unemployment Among Ages 55 to 59 years
Unemployment Among Ages 55 to 59 years Comparison
Immigrants from Mexico
Paiute
5.3%
UNEMPLOYMENT AMONG AGES 55 TO 59 YEARS
0.0/ 100
METRIC RATING
297th/ 347
METRIC RANK
6.8%
UNEMPLOYMENT AMONG AGES 55 TO 59 YEARS
0.0/ 100
METRIC RATING
337th/ 347
METRIC RANK
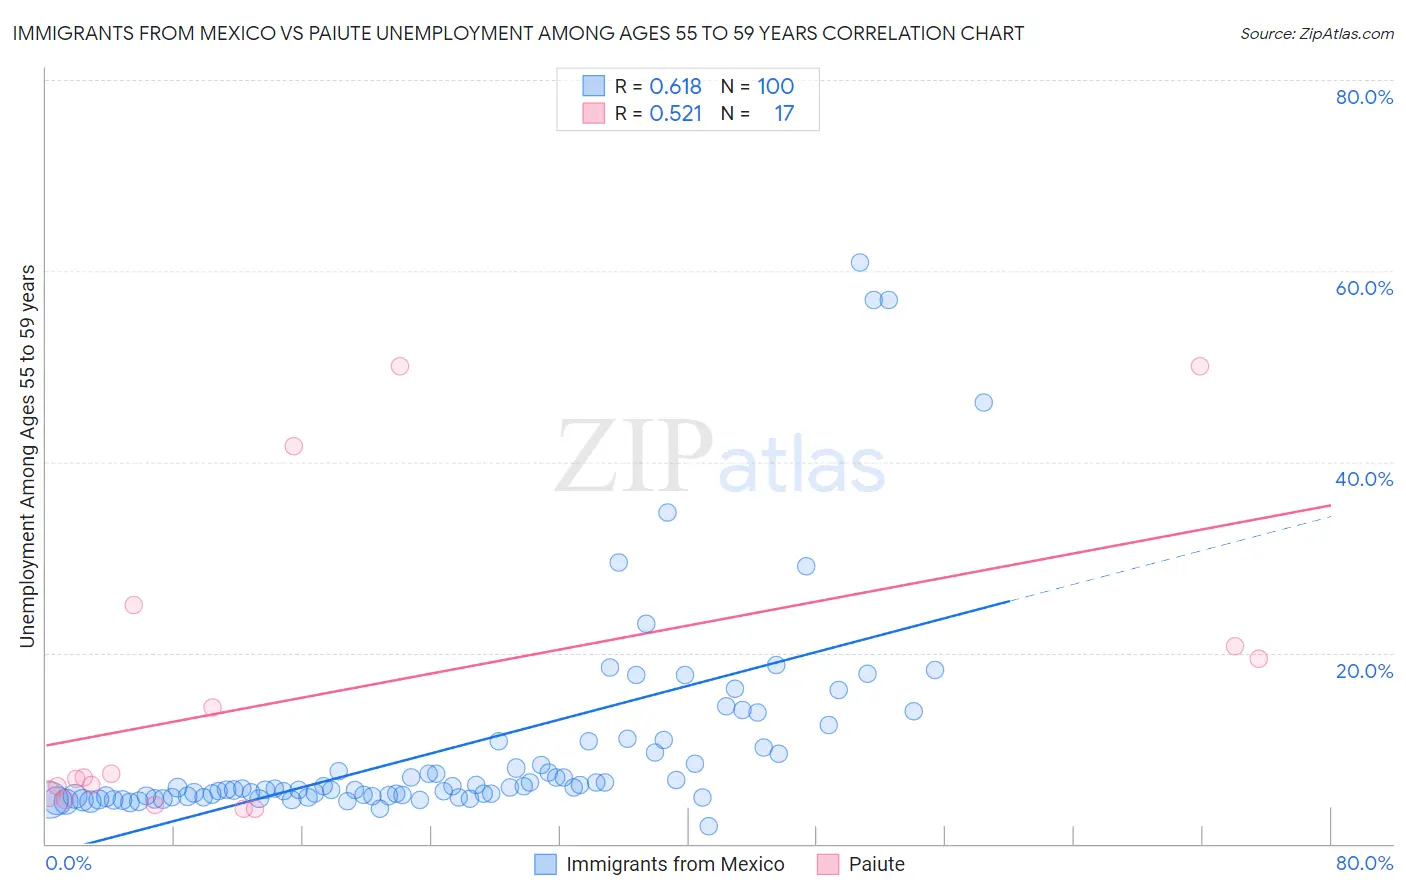
Immigrants from Mexico vs Paiute Unemployment Among Ages 55 to 59 years Correlation Chart
The statistical analysis conducted on geographies consisting of 453,807,695 people shows a significant positive correlation between the proportion of Immigrants from Mexico and unemployment rate among population between the ages 55 and 59 in the United States with a correlation coefficient (R) of 0.618 and weighted average of 5.3%. Similarly, the statistical analysis conducted on geographies consisting of 57,126,693 people shows a substantial positive correlation between the proportion of Paiute and unemployment rate among population between the ages 55 and 59 in the United States with a correlation coefficient (R) of 0.521 and weighted average of 6.8%, a difference of 26.4%.
Unemployment Among Ages 55 to 59 years Correlation Summary
| Measurement | Immigrants from Mexico | Paiute |
| Minimum | 1.8% | 3.7% |
| Maximum | 60.9% | 50.0% |
| Range | 59.1% | 46.3% |
| Mean | 10.1% | 16.2% |
| Median | 5.8% | 6.9% |
| Interquartile 25% (IQ1) | 4.9% | 5.0% |
| Interquartile 75% (IQ3) | 10.4% | 22.9% |
| Interquartile Range (IQR) | 5.5% | 17.9% |
| Standard Deviation (Sample) | 11.0% | 16.2% |
| Standard Deviation (Population) | 10.9% | 15.8% |
Similar Demographics by Unemployment Among Ages 55 to 59 years
Demographics Similar to Immigrants from Mexico by Unemployment Among Ages 55 to 59 years
In terms of unemployment among ages 55 to 59 years, the demographic groups most similar to Immigrants from Mexico are Barbadian (5.3%, a difference of 0.22%), Dutch West Indian (5.3%, a difference of 0.26%), Cajun (5.3%, a difference of 0.38%), Hispanic or Latino (5.4%, a difference of 0.38%), and Immigrants from Grenada (5.3%, a difference of 0.50%).
| Demographics | Rating | Rank | Unemployment Among Ages 55 to 59 years |
| Sioux | 0.0 /100 | #290 | Tragic 5.3% |
| Trinidadians and Tobagonians | 0.0 /100 | #291 | Tragic 5.3% |
| British West Indians | 0.0 /100 | #292 | Tragic 5.3% |
| Immigrants | Grenada | 0.0 /100 | #293 | Tragic 5.3% |
| Cajuns | 0.0 /100 | #294 | Tragic 5.3% |
| Dutch West Indians | 0.0 /100 | #295 | Tragic 5.3% |
| Barbadians | 0.0 /100 | #296 | Tragic 5.3% |
| Immigrants | Mexico | 0.0 /100 | #297 | Tragic 5.3% |
| Hispanics or Latinos | 0.0 /100 | #298 | Tragic 5.4% |
| Cape Verdeans | 0.0 /100 | #299 | Tragic 5.4% |
| Immigrants | St. Vincent and the Grenadines | 0.0 /100 | #300 | Tragic 5.4% |
| Immigrants | Dominica | 0.0 /100 | #301 | Tragic 5.5% |
| Sierra Leoneans | 0.0 /100 | #302 | Tragic 5.5% |
| Marshallese | 0.0 /100 | #303 | Tragic 5.5% |
| Blacks/African Americans | 0.0 /100 | #304 | Tragic 5.5% |
Demographics Similar to Paiute by Unemployment Among Ages 55 to 59 years
In terms of unemployment among ages 55 to 59 years, the demographic groups most similar to Paiute are Navajo (6.7%, a difference of 0.52%), Colville (6.7%, a difference of 0.67%), Pueblo (6.7%, a difference of 0.85%), Immigrants from Yemen (6.9%, a difference of 1.9%), and Pima (6.6%, a difference of 2.1%).
| Demographics | Rating | Rank | Unemployment Among Ages 55 to 59 years |
| Alaska Natives | 0.0 /100 | #330 | Tragic 6.2% |
| Immigrants | Dominican Republic | 0.0 /100 | #331 | Tragic 6.3% |
| Aleuts | 0.0 /100 | #332 | Tragic 6.4% |
| Pima | 0.0 /100 | #333 | Tragic 6.6% |
| Pueblo | 0.0 /100 | #334 | Tragic 6.7% |
| Colville | 0.0 /100 | #335 | Tragic 6.7% |
| Navajo | 0.0 /100 | #336 | Tragic 6.7% |
| Paiute | 0.0 /100 | #337 | Tragic 6.8% |
| Immigrants | Yemen | 0.0 /100 | #338 | Tragic 6.9% |
| Puerto Ricans | 0.0 /100 | #339 | Tragic 7.0% |
| Alaskan Athabascans | 0.0 /100 | #340 | Tragic 7.1% |
| Shoshone | 0.0 /100 | #341 | Tragic 7.4% |
| Hopi | 0.0 /100 | #342 | Tragic 8.1% |
| Yakama | 0.0 /100 | #343 | Tragic 8.9% |
| Inupiat | 0.0 /100 | #344 | Tragic 9.0% |