Immigrants from Iraq vs Estonian Unemployment Among Youth under 25 years
COMPARE
Immigrants from Iraq
Estonian
Unemployment Among Youth under 25 years
Unemployment Among Youth under 25 years Comparison
Immigrants from Iraq
Estonians
11.6%
UNEMPLOYMENT AMONG YOUTH UNDER 25 YEARS
47.0/ 100
METRIC RATING
175th/ 347
METRIC RANK
11.3%
UNEMPLOYMENT AMONG YOUTH UNDER 25 YEARS
94.2/ 100
METRIC RATING
98th/ 347
METRIC RANK
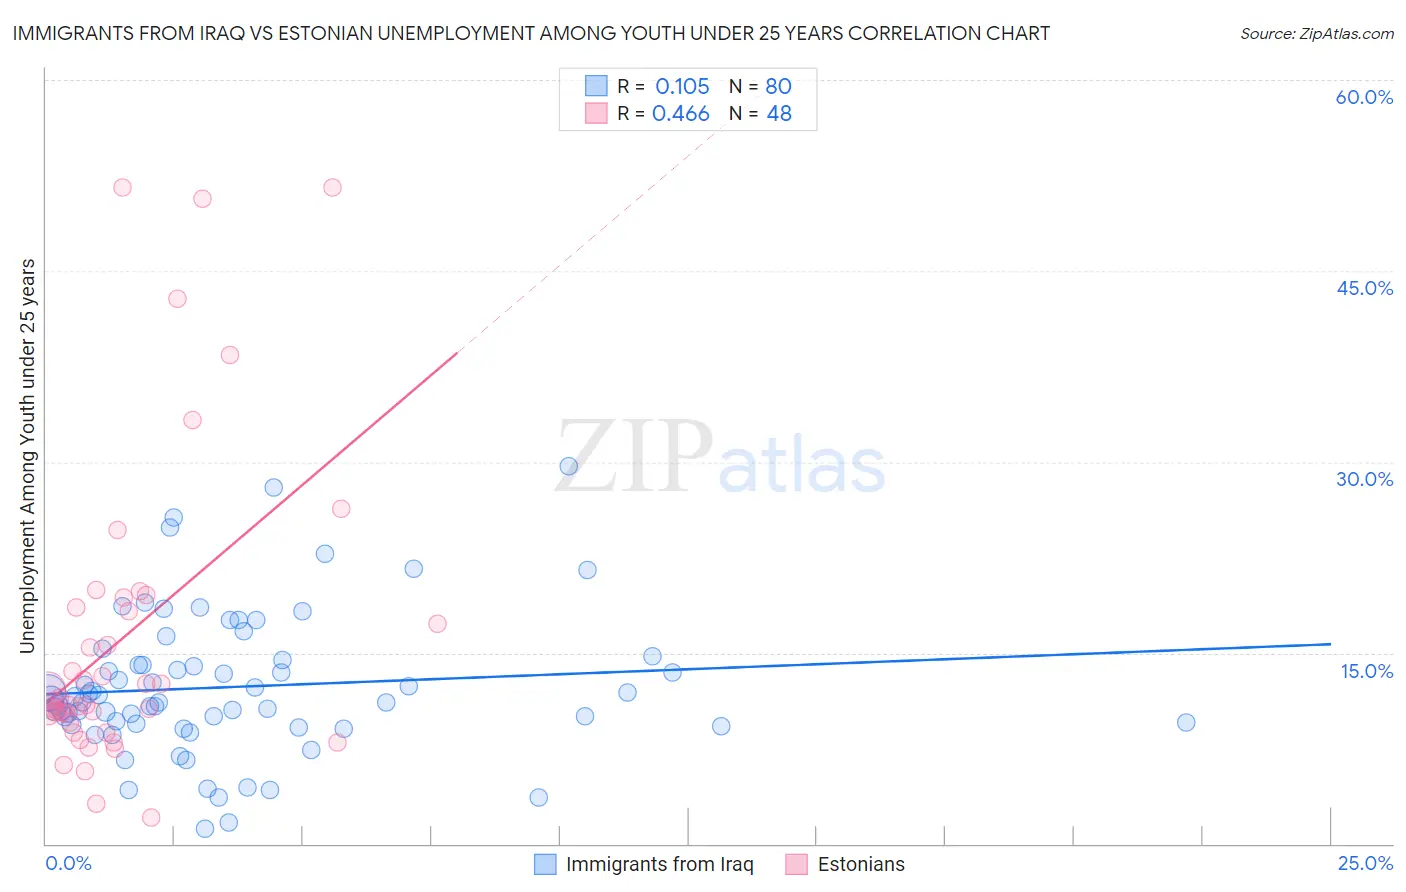
Immigrants from Iraq vs Estonian Unemployment Among Youth under 25 years Correlation Chart
The statistical analysis conducted on geographies consisting of 194,003,673 people shows a poor positive correlation between the proportion of Immigrants from Iraq and unemployment rate among youth under the age of 25 in the United States with a correlation coefficient (R) of 0.105 and weighted average of 11.6%. Similarly, the statistical analysis conducted on geographies consisting of 122,888,730 people shows a moderate positive correlation between the proportion of Estonians and unemployment rate among youth under the age of 25 in the United States with a correlation coefficient (R) of 0.466 and weighted average of 11.3%, a difference of 3.1%.
Unemployment Among Youth under 25 years Correlation Summary
| Measurement | Immigrants from Iraq | Estonian |
| Minimum | 1.2% | 2.1% |
| Maximum | 29.7% | 51.6% |
| Range | 28.5% | 49.5% |
| Mean | 12.3% | 16.3% |
| Median | 11.3% | 11.4% |
| Interquartile 25% (IQ1) | 9.4% | 9.8% |
| Interquartile 75% (IQ3) | 14.2% | 18.9% |
| Interquartile Range (IQR) | 4.9% | 9.1% |
| Standard Deviation (Sample) | 5.6% | 12.2% |
| Standard Deviation (Population) | 5.5% | 12.1% |
Similar Demographics by Unemployment Among Youth under 25 years
Demographics Similar to Immigrants from Iraq by Unemployment Among Youth under 25 years
In terms of unemployment among youth under 25 years, the demographic groups most similar to Immigrants from Iraq are Ugandan (11.6%, a difference of 0.060%), Immigrants from Denmark (11.6%, a difference of 0.090%), Immigrants from China (11.6%, a difference of 0.12%), Immigrants from South Eastern Asia (11.6%, a difference of 0.19%), and Immigrants from Europe (11.6%, a difference of 0.19%).
| Demographics | Rating | Rank | Unemployment Among Youth under 25 years |
| Potawatomi | 57.9 /100 | #168 | Average 11.6% |
| Eastern Europeans | 57.5 /100 | #169 | Average 11.6% |
| Russians | 57.3 /100 | #170 | Average 11.6% |
| Bangladeshis | 55.6 /100 | #171 | Average 11.6% |
| Immigrants | Morocco | 55.1 /100 | #172 | Average 11.6% |
| Immigrants | South Eastern Asia | 51.7 /100 | #173 | Average 11.6% |
| Immigrants | China | 50.0 /100 | #174 | Average 11.6% |
| Immigrants | Iraq | 47.0 /100 | #175 | Average 11.6% |
| Ugandans | 45.6 /100 | #176 | Average 11.6% |
| Immigrants | Denmark | 45.0 /100 | #177 | Average 11.6% |
| Immigrants | Europe | 42.4 /100 | #178 | Average 11.6% |
| Immigrants | Hong Kong | 42.4 /100 | #179 | Average 11.6% |
| Spaniards | 39.8 /100 | #180 | Fair 11.7% |
| Syrians | 38.4 /100 | #181 | Fair 11.7% |
| Immigrants | Italy | 36.2 /100 | #182 | Fair 11.7% |
Demographics Similar to Estonians by Unemployment Among Youth under 25 years
In terms of unemployment among youth under 25 years, the demographic groups most similar to Estonians are Nicaraguan (11.3%, a difference of 0.0%), Immigrants from Serbia (11.3%, a difference of 0.020%), Carpatho Rusyn (11.3%, a difference of 0.040%), Celtic (11.3%, a difference of 0.050%), and Pakistani (11.3%, a difference of 0.050%).
| Demographics | Rating | Rank | Unemployment Among Youth under 25 years |
| Immigrants | Taiwan | 95.1 /100 | #91 | Exceptional 11.2% |
| Immigrants | Latvia | 95.1 /100 | #92 | Exceptional 11.2% |
| Immigrants | North America | 95.1 /100 | #93 | Exceptional 11.2% |
| Lithuanians | 94.8 /100 | #94 | Exceptional 11.3% |
| Carpatho Rusyns | 94.4 /100 | #95 | Exceptional 11.3% |
| Immigrants | Serbia | 94.4 /100 | #96 | Exceptional 11.3% |
| Nicaraguans | 94.3 /100 | #97 | Exceptional 11.3% |
| Estonians | 94.2 /100 | #98 | Exceptional 11.3% |
| Celtics | 94.0 /100 | #99 | Exceptional 11.3% |
| Pakistanis | 94.0 /100 | #100 | Exceptional 11.3% |
| Iroquois | 93.8 /100 | #101 | Exceptional 11.3% |
| Immigrants | Thailand | 93.6 /100 | #102 | Exceptional 11.3% |
| Immigrants | Malaysia | 93.6 /100 | #103 | Exceptional 11.3% |
| Immigrants | Afghanistan | 93.4 /100 | #104 | Exceptional 11.3% |
| Immigrants | Jordan | 93.1 /100 | #105 | Exceptional 11.3% |