Immigrants from Switzerland vs Immigrants from Kazakhstan Unemployment Among Youth under 25 years
COMPARE
Immigrants from Switzerland
Immigrants from Kazakhstan
Unemployment Among Youth under 25 years
Unemployment Among Youth under 25 years Comparison
Immigrants from Switzerland
Immigrants from Kazakhstan
11.5%
UNEMPLOYMENT AMONG YOUTH UNDER 25 YEARS
71.6/ 100
METRIC RATING
150th/ 347
METRIC RANK
11.5%
UNEMPLOYMENT AMONG YOUTH UNDER 25 YEARS
62.7/ 100
METRIC RATING
163rd/ 347
METRIC RANK
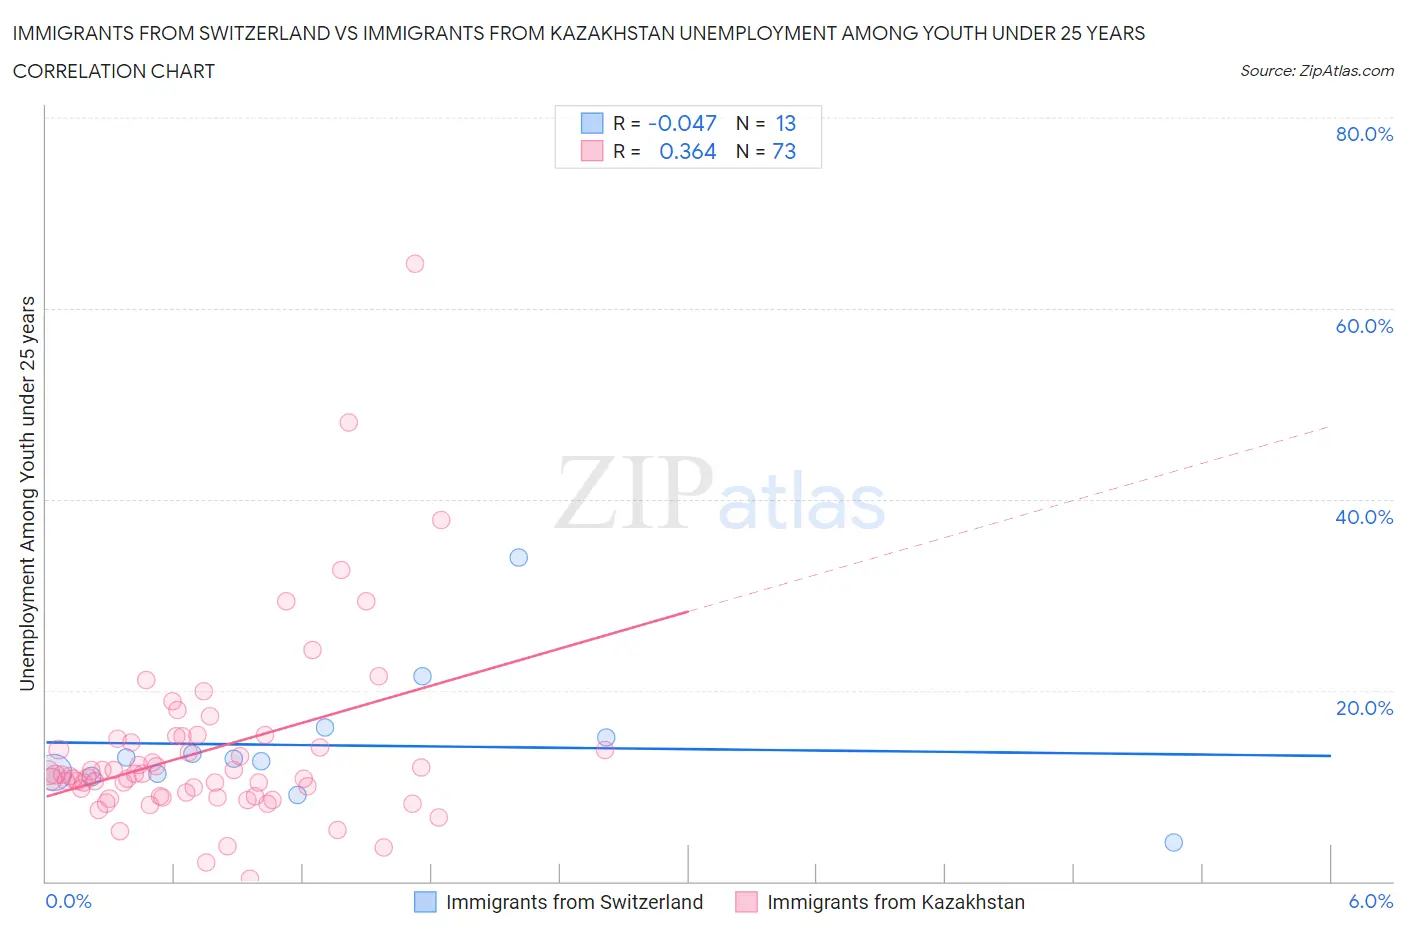
Immigrants from Switzerland vs Immigrants from Kazakhstan Unemployment Among Youth under 25 years Correlation Chart
The statistical analysis conducted on geographies consisting of 147,127,342 people shows no correlation between the proportion of Immigrants from Switzerland and unemployment rate among youth under the age of 25 in the United States with a correlation coefficient (R) of -0.047 and weighted average of 11.5%. Similarly, the statistical analysis conducted on geographies consisting of 124,142,659 people shows a mild positive correlation between the proportion of Immigrants from Kazakhstan and unemployment rate among youth under the age of 25 in the United States with a correlation coefficient (R) of 0.364 and weighted average of 11.5%, a difference of 0.42%.
Unemployment Among Youth under 25 years Correlation Summary
| Measurement | Immigrants from Switzerland | Immigrants from Kazakhstan |
| Minimum | 4.0% | 0.20% |
| Maximum | 33.9% | 64.7% |
| Range | 29.9% | 64.5% |
| Mean | 14.2% | 13.7% |
| Median | 12.9% | 11.1% |
| Interquartile 25% (IQ1) | 11.1% | 8.9% |
| Interquartile 75% (IQ3) | 15.5% | 14.7% |
| Interquartile Range (IQR) | 4.4% | 5.8% |
| Standard Deviation (Sample) | 7.1% | 9.8% |
| Standard Deviation (Population) | 6.8% | 9.7% |
Demographics Similar to Immigrants from Switzerland and Immigrants from Kazakhstan by Unemployment Among Youth under 25 years
In terms of unemployment among youth under 25 years, the demographic groups most similar to Immigrants from Switzerland are Immigrants from Cambodia (11.5%, a difference of 0.010%), Immigrants from Northern Europe (11.5%, a difference of 0.020%), Laotian (11.5%, a difference of 0.040%), Brazilian (11.5%, a difference of 0.050%), and Uruguayan (11.5%, a difference of 0.060%). Similarly, the demographic groups most similar to Immigrants from Kazakhstan are Immigrants from Northern Africa (11.5%, a difference of 0.0%), Immigrants from Laos (11.5%, a difference of 0.010%), Immigrants from Sweden (11.5%, a difference of 0.060%), Ukrainian (11.5%, a difference of 0.070%), and Immigrants from Eastern Asia (11.5%, a difference of 0.080%).
| Demographics | Rating | Rank | Unemployment Among Youth under 25 years |
| Brazilians | 72.5 /100 | #146 | Good 11.5% |
| Laotians | 72.4 /100 | #147 | Good 11.5% |
| Immigrants | Northern Europe | 72.1 /100 | #148 | Good 11.5% |
| Immigrants | Cambodia | 71.8 /100 | #149 | Good 11.5% |
| Immigrants | Switzerland | 71.6 /100 | #150 | Good 11.5% |
| Uruguayans | 70.4 /100 | #151 | Good 11.5% |
| Iraqis | 68.3 /100 | #152 | Good 11.5% |
| Immigrants | Czechoslovakia | 67.1 /100 | #153 | Good 11.5% |
| Immigrants | Asia | 66.7 /100 | #154 | Good 11.5% |
| Immigrants | Romania | 66.3 /100 | #155 | Good 11.5% |
| Immigrants | Germany | 65.9 /100 | #156 | Good 11.5% |
| Indians (Asian) | 65.1 /100 | #157 | Good 11.5% |
| Immigrants | Turkey | 64.8 /100 | #158 | Good 11.5% |
| Immigrants | Western Europe | 64.7 /100 | #159 | Good 11.5% |
| Immigrants | Eastern Asia | 64.5 /100 | #160 | Good 11.5% |
| Ukrainians | 64.3 /100 | #161 | Good 11.5% |
| Immigrants | Northern Africa | 62.7 /100 | #162 | Good 11.5% |
| Immigrants | Kazakhstan | 62.7 /100 | #163 | Good 11.5% |
| Immigrants | Laos | 62.4 /100 | #164 | Good 11.5% |
| Immigrants | Sweden | 61.3 /100 | #165 | Good 11.5% |
| Spanish | 60.3 /100 | #166 | Good 11.6% |