Immigrants from Croatia vs Scandinavian Unemployment
COMPARE
Immigrants from Croatia
Scandinavian
Unemployment
Unemployment Comparison
Immigrants from Croatia
Scandinavians
5.1%
UNEMPLOYMENT
86.8/ 100
METRIC RATING
131st/ 347
METRIC RANK
4.5%
UNEMPLOYMENT
100.0/ 100
METRIC RATING
9th/ 347
METRIC RANK
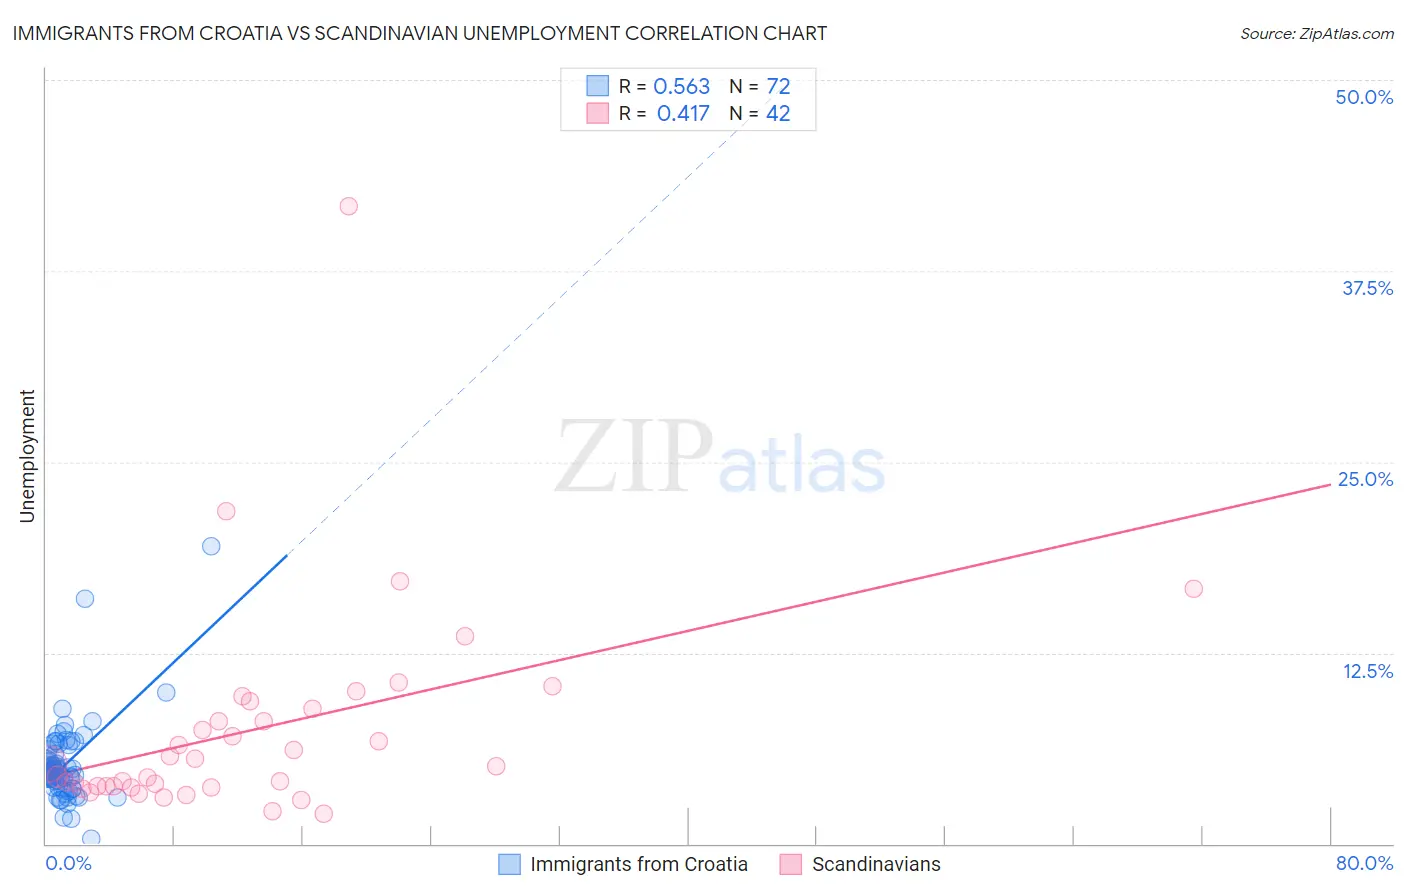
Immigrants from Croatia vs Scandinavian Unemployment Correlation Chart
The statistical analysis conducted on geographies consisting of 132,546,929 people shows a substantial positive correlation between the proportion of Immigrants from Croatia and unemployment in the United States with a correlation coefficient (R) of 0.563 and weighted average of 5.1%. Similarly, the statistical analysis conducted on geographies consisting of 471,134,185 people shows a moderate positive correlation between the proportion of Scandinavians and unemployment in the United States with a correlation coefficient (R) of 0.417 and weighted average of 4.5%, a difference of 12.3%.
Unemployment Correlation Summary
| Measurement | Immigrants from Croatia | Scandinavian |
| Minimum | 0.30% | 2.0% |
| Maximum | 19.5% | 41.7% |
| Range | 19.2% | 39.7% |
| Mean | 5.2% | 7.4% |
| Median | 4.7% | 5.2% |
| Interquartile 25% (IQ1) | 3.9% | 3.7% |
| Interquartile 75% (IQ3) | 6.0% | 8.8% |
| Interquartile Range (IQR) | 2.2% | 5.1% |
| Standard Deviation (Sample) | 2.7% | 6.9% |
| Standard Deviation (Population) | 2.7% | 6.8% |
Similar Demographics by Unemployment
Demographics Similar to Immigrants from Croatia by Unemployment
In terms of unemployment, the demographic groups most similar to Immigrants from Croatia are Immigrants from Ethiopia (5.1%, a difference of 0.010%), Immigrants from Jordan (5.1%, a difference of 0.020%), Iranian (5.1%, a difference of 0.030%), Immigrants from Europe (5.1%, a difference of 0.060%), and Immigrants from Burma/Myanmar (5.1%, a difference of 0.070%).
| Demographics | Rating | Rank | Unemployment |
| Ethiopians | 88.6 /100 | #124 | Excellent 5.1% |
| Immigrants | Eastern Asia | 88.3 /100 | #125 | Excellent 5.1% |
| Kenyans | 88.2 /100 | #126 | Excellent 5.1% |
| Immigrants | Kenya | 88.2 /100 | #127 | Excellent 5.1% |
| Immigrants | Eastern Africa | 88.1 /100 | #128 | Excellent 5.1% |
| Immigrants | Latvia | 88.0 /100 | #129 | Excellent 5.1% |
| Iranians | 86.9 /100 | #130 | Excellent 5.1% |
| Immigrants | Croatia | 86.8 /100 | #131 | Excellent 5.1% |
| Immigrants | Ethiopia | 86.7 /100 | #132 | Excellent 5.1% |
| Immigrants | Jordan | 86.6 /100 | #133 | Excellent 5.1% |
| Immigrants | Europe | 86.3 /100 | #134 | Excellent 5.1% |
| Immigrants | Burma/Myanmar | 86.2 /100 | #135 | Excellent 5.1% |
| Immigrants | Spain | 86.2 /100 | #136 | Excellent 5.1% |
| Immigrants | Saudi Arabia | 85.6 /100 | #137 | Excellent 5.1% |
| Immigrants | Hungary | 85.6 /100 | #138 | Excellent 5.1% |
Demographics Similar to Scandinavians by Unemployment
In terms of unemployment, the demographic groups most similar to Scandinavians are Swiss (4.5%, a difference of 0.39%), Dutch (4.6%, a difference of 0.51%), Immigrants from India (4.5%, a difference of 0.86%), English (4.6%, a difference of 1.2%), and Pennsylvania German (4.6%, a difference of 1.3%).
| Demographics | Rating | Rank | Unemployment |
| Luxembourgers | 100.0 /100 | #2 | Exceptional 4.3% |
| Czechs | 100.0 /100 | #3 | Exceptional 4.3% |
| Danes | 100.0 /100 | #4 | Exceptional 4.3% |
| Swedes | 100.0 /100 | #5 | Exceptional 4.4% |
| Germans | 100.0 /100 | #6 | Exceptional 4.5% |
| Immigrants | India | 100.0 /100 | #7 | Exceptional 4.5% |
| Swiss | 100.0 /100 | #8 | Exceptional 4.5% |
| Scandinavians | 100.0 /100 | #9 | Exceptional 4.5% |
| Dutch | 100.0 /100 | #10 | Exceptional 4.6% |
| English | 100.0 /100 | #11 | Exceptional 4.6% |
| Pennsylvania Germans | 100.0 /100 | #12 | Exceptional 4.6% |
| Belgians | 100.0 /100 | #13 | Exceptional 4.6% |
| Immigrants | Cuba | 100.0 /100 | #14 | Exceptional 4.6% |
| Europeans | 99.9 /100 | #15 | Exceptional 4.6% |
| Chinese | 99.9 /100 | #16 | Exceptional 4.7% |