Menominee vs Haitian Female Unemployment
COMPARE
Menominee
Haitian
Female Unemployment
Female Unemployment Comparison
Menominee
Haitians
7.0%
FEMALE UNEMPLOYMENT
0.0/ 100
METRIC RATING
333rd/ 347
METRIC RANK
6.1%
FEMALE UNEMPLOYMENT
0.0/ 100
METRIC RATING
288th/ 347
METRIC RANK
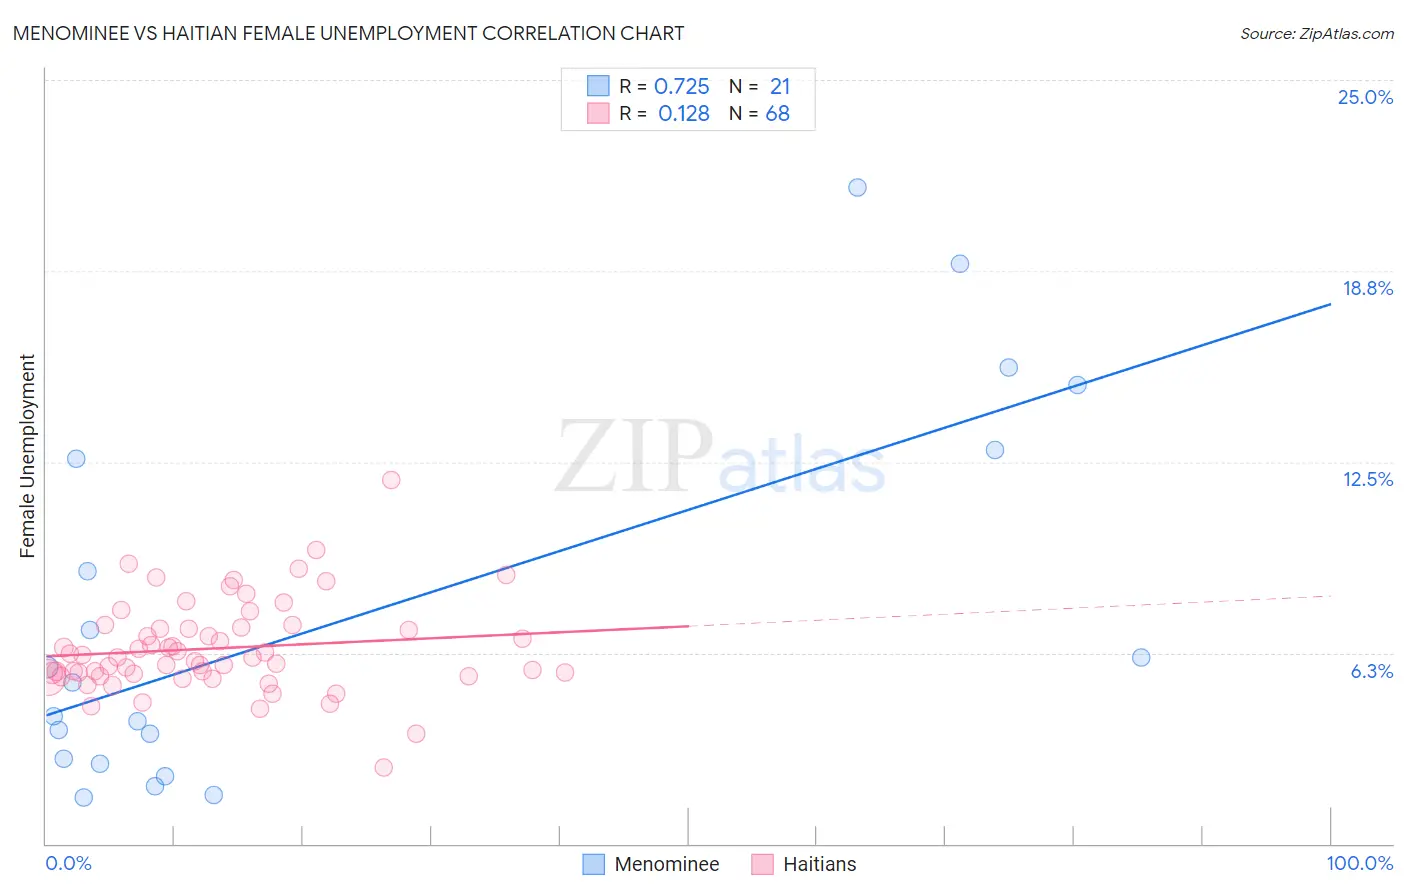
Menominee vs Haitian Female Unemployment Correlation Chart
The statistical analysis conducted on geographies consisting of 45,628,171 people shows a strong positive correlation between the proportion of Menominee and unemploymnet rate among females in the United States with a correlation coefficient (R) of 0.725 and weighted average of 7.0%. Similarly, the statistical analysis conducted on geographies consisting of 287,205,640 people shows a poor positive correlation between the proportion of Haitians and unemploymnet rate among females in the United States with a correlation coefficient (R) of 0.128 and weighted average of 6.1%, a difference of 15.7%.
Female Unemployment Correlation Summary
| Measurement | Menominee | Haitian |
| Minimum | 1.5% | 2.5% |
| Maximum | 21.5% | 11.9% |
| Range | 20.0% | 9.4% |
| Mean | 7.5% | 6.4% |
| Median | 5.3% | 6.1% |
| Interquartile 25% (IQ1) | 2.7% | 5.5% |
| Interquartile 75% (IQ3) | 12.7% | 7.1% |
| Interquartile Range (IQR) | 10.0% | 1.5% |
| Standard Deviation (Sample) | 6.1% | 1.5% |
| Standard Deviation (Population) | 6.0% | 1.5% |
Similar Demographics by Female Unemployment
Demographics Similar to Menominee by Female Unemployment
In terms of female unemployment, the demographic groups most similar to Menominee are Sioux (7.0%, a difference of 0.020%), Immigrants from Armenia (7.1%, a difference of 0.41%), Dominican (7.2%, a difference of 1.8%), Immigrants from Dominican Republic (7.2%, a difference of 2.5%), and Navajo (7.3%, a difference of 3.5%).
| Demographics | Rating | Rank | Female Unemployment |
| Natives/Alaskans | 0.0 /100 | #326 | Tragic 6.6% |
| Alaska Natives | 0.0 /100 | #327 | Tragic 6.6% |
| Guyanese | 0.0 /100 | #328 | Tragic 6.7% |
| Immigrants | Guyana | 0.0 /100 | #329 | Tragic 6.7% |
| Yakama | 0.0 /100 | #330 | Tragic 6.7% |
| Paiute | 0.0 /100 | #331 | Tragic 6.8% |
| Sioux | 0.0 /100 | #332 | Tragic 7.0% |
| Menominee | 0.0 /100 | #333 | Tragic 7.0% |
| Immigrants | Armenia | 0.0 /100 | #334 | Tragic 7.1% |
| Dominicans | 0.0 /100 | #335 | Tragic 7.2% |
| Immigrants | Dominican Republic | 0.0 /100 | #336 | Tragic 7.2% |
| Navajo | 0.0 /100 | #337 | Tragic 7.3% |
| Tohono O'odham | 0.0 /100 | #338 | Tragic 7.7% |
| Immigrants | Yemen | 0.0 /100 | #339 | Tragic 7.8% |
| Hopi | 0.0 /100 | #340 | Tragic 8.1% |
Demographics Similar to Haitians by Female Unemployment
In terms of female unemployment, the demographic groups most similar to Haitians are Trinidadian and Tobagonian (6.1%, a difference of 0.010%), Immigrants from Guatemala (6.1%, a difference of 0.040%), Chippewa (6.1%, a difference of 0.070%), Immigrants from Caribbean (6.1%, a difference of 0.070%), and Immigrants from Cabo Verde (6.1%, a difference of 0.10%).
| Demographics | Rating | Rank | Female Unemployment |
| Guatemalans | 0.0 /100 | #281 | Tragic 6.0% |
| Colville | 0.0 /100 | #282 | Tragic 6.0% |
| Salvadorans | 0.0 /100 | #283 | Tragic 6.0% |
| Immigrants | Senegal | 0.0 /100 | #284 | Tragic 6.1% |
| Immigrants | Cabo Verde | 0.0 /100 | #285 | Tragic 6.1% |
| Chippewa | 0.0 /100 | #286 | Tragic 6.1% |
| Immigrants | Guatemala | 0.0 /100 | #287 | Tragic 6.1% |
| Haitians | 0.0 /100 | #288 | Tragic 6.1% |
| Trinidadians and Tobagonians | 0.0 /100 | #289 | Tragic 6.1% |
| Immigrants | Caribbean | 0.0 /100 | #290 | Tragic 6.1% |
| Immigrants | West Indies | 0.0 /100 | #291 | Tragic 6.1% |
| Immigrants | Trinidad and Tobago | 0.0 /100 | #292 | Tragic 6.1% |
| Mexicans | 0.0 /100 | #293 | Tragic 6.1% |
| Immigrants | El Salvador | 0.0 /100 | #294 | Tragic 6.1% |
| Immigrants | Latin America | 0.0 /100 | #295 | Tragic 6.1% |