Immigrants from St. Vincent and the Grenadines vs Lebanese Unemployment Among Seniors over 75 years
COMPARE
Immigrants from St. Vincent and the Grenadines
Lebanese
Unemployment Among Seniors over 75 years
Unemployment Among Seniors over 75 years Comparison
Immigrants from St. Vincent and the Grenadines
Lebanese
9.8%
UNEMPLOYMENT AMONG SENIORS OVER 75 YEARS
0.0/ 100
METRIC RATING
296th/ 347
METRIC RANK
9.0%
UNEMPLOYMENT AMONG SENIORS OVER 75 YEARS
11.1/ 100
METRIC RATING
217th/ 347
METRIC RANK
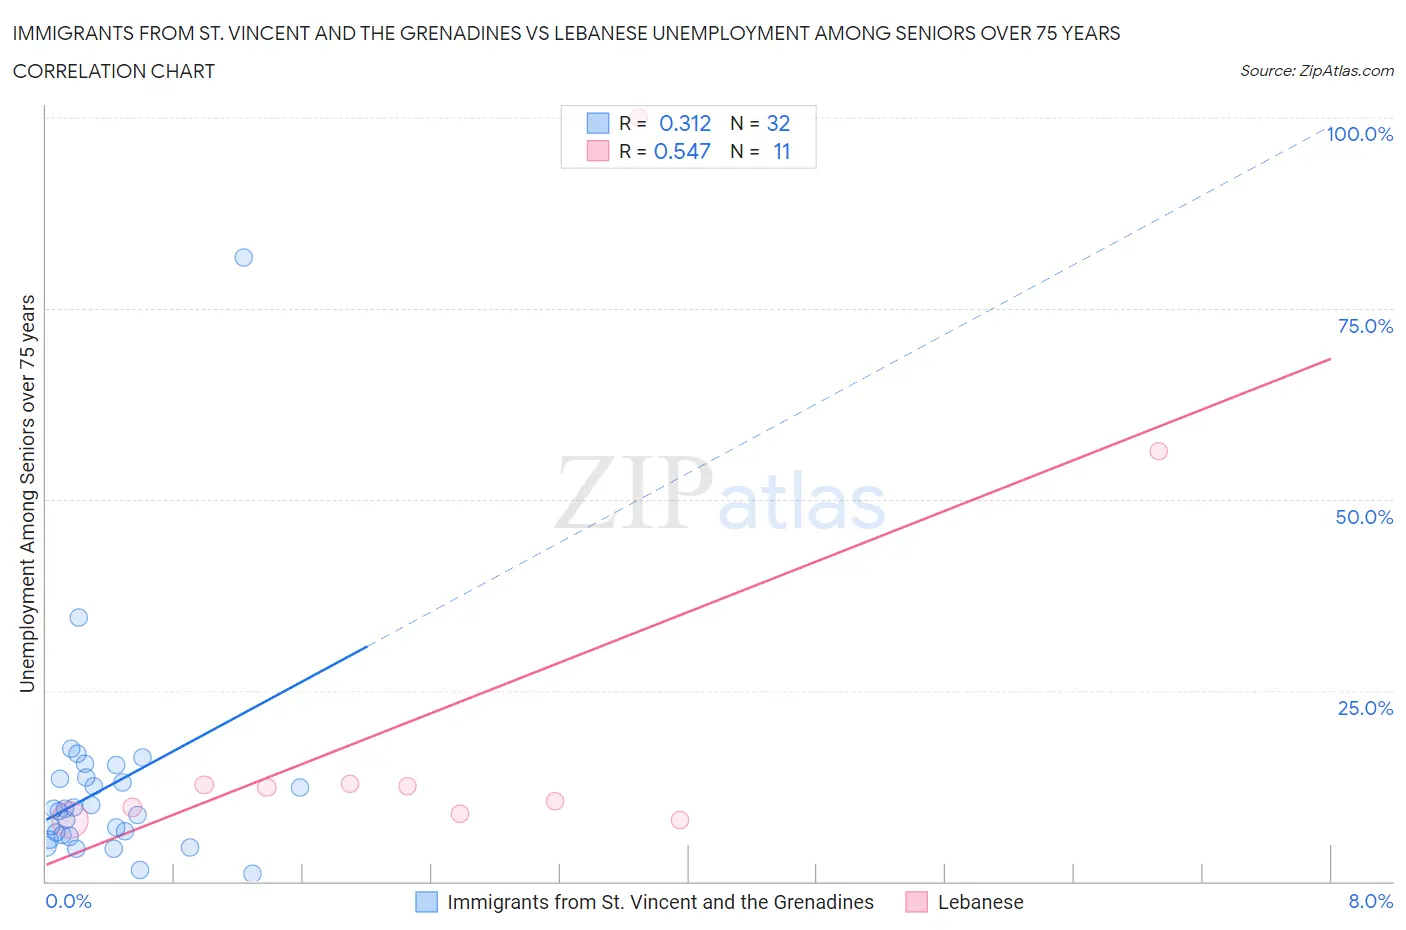
Immigrants from St. Vincent and the Grenadines vs Lebanese Unemployment Among Seniors over 75 years Correlation Chart
The statistical analysis conducted on geographies consisting of 44,044,285 people shows a mild positive correlation between the proportion of Immigrants from St. Vincent and the Grenadines and unemployment rate among seniors over the age of 75 in the United States with a correlation coefficient (R) of 0.312 and weighted average of 9.8%. Similarly, the statistical analysis conducted on geographies consisting of 202,998,539 people shows a substantial positive correlation between the proportion of Lebanese and unemployment rate among seniors over the age of 75 in the United States with a correlation coefficient (R) of 0.547 and weighted average of 9.0%, a difference of 9.4%.
Unemployment Among Seniors over 75 years Correlation Summary
| Measurement | Immigrants from St. Vincent and the Grenadines | Lebanese |
| Minimum | 1.0% | 8.0% |
| Maximum | 81.7% | 100.0% |
| Range | 80.7% | 92.0% |
| Mean | 12.2% | 22.9% |
| Median | 9.3% | 12.3% |
| Interquartile 25% (IQ1) | 6.0% | 8.8% |
| Interquartile 75% (IQ3) | 13.5% | 12.8% |
| Interquartile Range (IQR) | 7.5% | 4.0% |
| Standard Deviation (Sample) | 14.2% | 29.1% |
| Standard Deviation (Population) | 13.9% | 27.7% |
Similar Demographics by Unemployment Among Seniors over 75 years
Demographics Similar to Immigrants from St. Vincent and the Grenadines by Unemployment Among Seniors over 75 years
In terms of unemployment among seniors over 75 years, the demographic groups most similar to Immigrants from St. Vincent and the Grenadines are Nonimmigrants (9.8%, a difference of 0.050%), Cherokee (9.8%, a difference of 0.080%), Immigrants from Dominica (9.8%, a difference of 0.41%), Lithuanian (9.9%, a difference of 0.46%), and Norwegian (9.8%, a difference of 0.47%).
| Demographics | Rating | Rank | Unemployment Among Seniors over 75 years |
| Czechs | 0.0 /100 | #289 | Tragic 9.7% |
| Sioux | 0.0 /100 | #290 | Tragic 9.7% |
| Scandinavians | 0.0 /100 | #291 | Tragic 9.7% |
| Immigrants | Western Africa | 0.0 /100 | #292 | Tragic 9.8% |
| Norwegians | 0.0 /100 | #293 | Tragic 9.8% |
| Immigrants | Dominica | 0.0 /100 | #294 | Tragic 9.8% |
| Immigrants | Nonimmigrants | 0.0 /100 | #295 | Tragic 9.8% |
| Immigrants | St. Vincent and the Grenadines | 0.0 /100 | #296 | Tragic 9.8% |
| Cherokee | 0.0 /100 | #297 | Tragic 9.8% |
| Lithuanians | 0.0 /100 | #298 | Tragic 9.9% |
| Belgians | 0.0 /100 | #299 | Tragic 9.9% |
| Iraqis | 0.0 /100 | #300 | Tragic 9.9% |
| Welsh | 0.0 /100 | #301 | Tragic 10.0% |
| Finns | 0.0 /100 | #302 | Tragic 10.0% |
| Puget Sound Salish | 0.0 /100 | #303 | Tragic 10.0% |
Demographics Similar to Lebanese by Unemployment Among Seniors over 75 years
In terms of unemployment among seniors over 75 years, the demographic groups most similar to Lebanese are Immigrants from Oceania (9.0%, a difference of 0.10%), Immigrants from Western Asia (9.0%, a difference of 0.18%), Immigrants from Africa (9.0%, a difference of 0.19%), Immigrants from Brazil (9.0%, a difference of 0.27%), and Immigrants from Latin America (9.0%, a difference of 0.29%).
| Demographics | Rating | Rank | Unemployment Among Seniors over 75 years |
| Bermudans | 15.0 /100 | #210 | Poor 8.9% |
| Delaware | 14.6 /100 | #211 | Poor 9.0% |
| Romanians | 13.8 /100 | #212 | Poor 9.0% |
| Immigrants | Latin America | 13.4 /100 | #213 | Poor 9.0% |
| Immigrants | Brazil | 13.3 /100 | #214 | Poor 9.0% |
| Immigrants | Western Asia | 12.5 /100 | #215 | Poor 9.0% |
| Immigrants | Oceania | 11.8 /100 | #216 | Poor 9.0% |
| Lebanese | 11.1 /100 | #217 | Poor 9.0% |
| Immigrants | Africa | 9.7 /100 | #218 | Tragic 9.0% |
| Afghans | 8.3 /100 | #219 | Tragic 9.0% |
| Immigrants | Zimbabwe | 7.8 /100 | #220 | Tragic 9.0% |
| Guamanians/Chamorros | 7.7 /100 | #221 | Tragic 9.0% |
| Peruvians | 7.3 /100 | #222 | Tragic 9.0% |
| Immigrants | Jordan | 6.9 /100 | #223 | Tragic 9.0% |
| Costa Ricans | 6.3 /100 | #224 | Tragic 9.1% |