Immigrants from Spain vs Immigrants from Colombia Unemployment Among Ages 45 to 54 years
COMPARE
Immigrants from Spain
Immigrants from Colombia
Unemployment Among Ages 45 to 54 years
Unemployment Among Ages 45 to 54 years Comparison
Immigrants from Spain
Immigrants from Colombia
4.5%
UNEMPLOYMENT AMONG AGES 45 TO 54 YEARS
72.5/ 100
METRIC RATING
154th/ 347
METRIC RANK
4.5%
UNEMPLOYMENT AMONG AGES 45 TO 54 YEARS
52.0/ 100
METRIC RATING
173rd/ 347
METRIC RANK
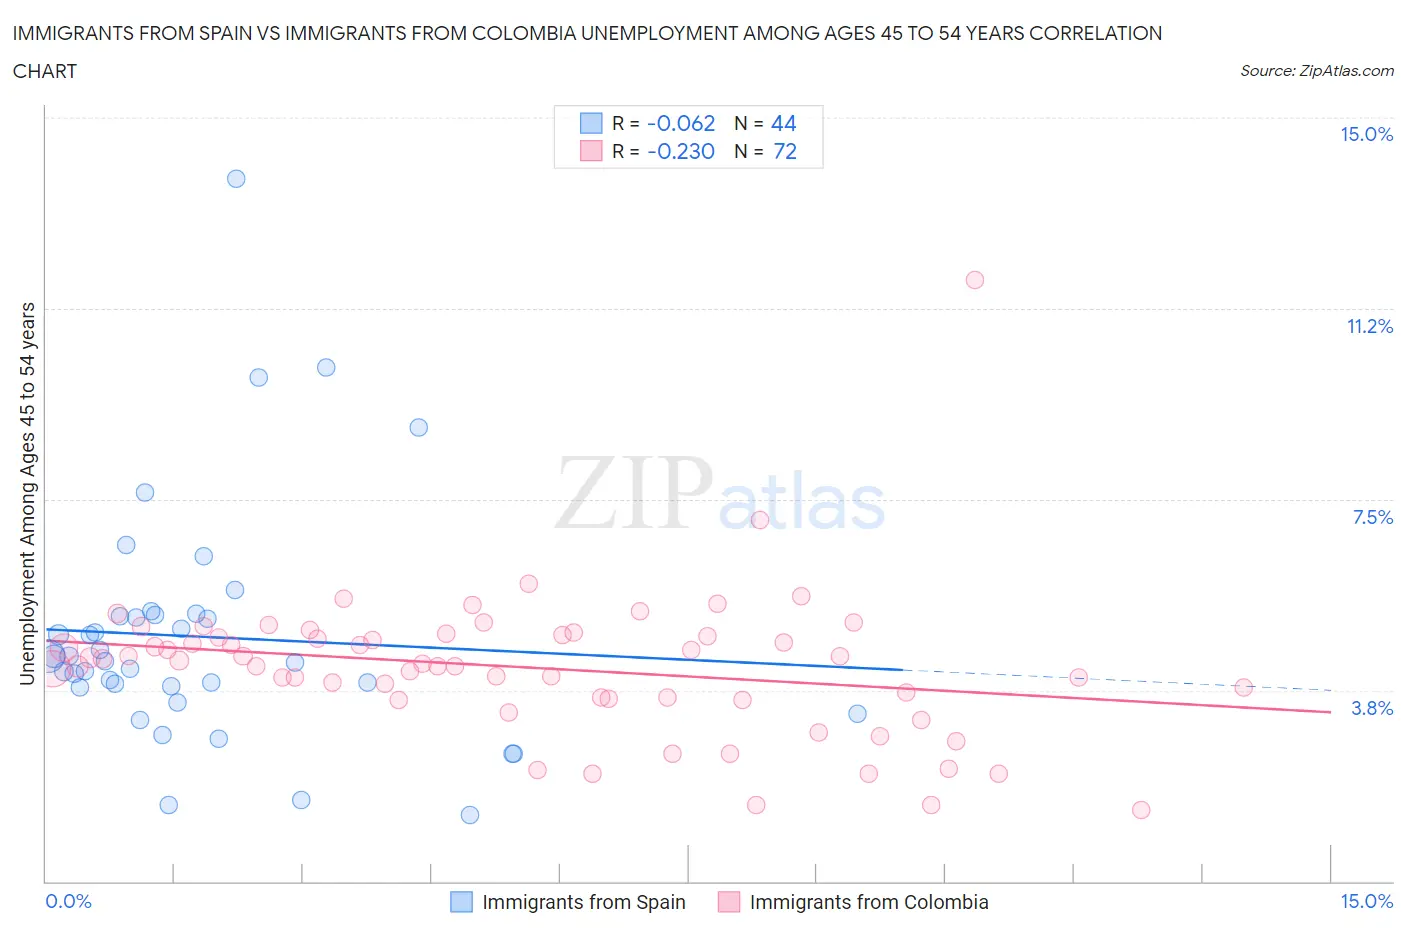
Immigrants from Spain vs Immigrants from Colombia Unemployment Among Ages 45 to 54 years Correlation Chart
The statistical analysis conducted on geographies consisting of 236,545,897 people shows a slight negative correlation between the proportion of Immigrants from Spain and unemployment rate among population between the ages 45 and 54 in the United States with a correlation coefficient (R) of -0.062 and weighted average of 4.5%. Similarly, the statistical analysis conducted on geographies consisting of 370,552,146 people shows a weak negative correlation between the proportion of Immigrants from Colombia and unemployment rate among population between the ages 45 and 54 in the United States with a correlation coefficient (R) of -0.230 and weighted average of 4.5%, a difference of 1.1%.
Unemployment Among Ages 45 to 54 years Correlation Summary
| Measurement | Immigrants from Spain | Immigrants from Colombia |
| Minimum | 1.3% | 1.4% |
| Maximum | 13.8% | 11.8% |
| Range | 12.5% | 10.4% |
| Mean | 4.8% | 4.2% |
| Median | 4.4% | 4.3% |
| Interquartile 25% (IQ1) | 3.8% | 3.6% |
| Interquartile 75% (IQ3) | 5.2% | 4.8% |
| Interquartile Range (IQR) | 1.4% | 1.2% |
| Standard Deviation (Sample) | 2.3% | 1.4% |
| Standard Deviation (Population) | 2.3% | 1.4% |
Demographics Similar to Immigrants from Spain and Immigrants from Colombia by Unemployment Among Ages 45 to 54 years
In terms of unemployment among ages 45 to 54 years, the demographic groups most similar to Immigrants from Spain are Hungarian (4.5%, a difference of 0.030%), Marshallese (4.5%, a difference of 0.11%), Immigrants from Croatia (4.5%, a difference of 0.17%), Indian (Asian) (4.5%, a difference of 0.25%), and Immigrants from Italy (4.5%, a difference of 0.39%). Similarly, the demographic groups most similar to Immigrants from Colombia are Colombian (4.5%, a difference of 0.060%), Egyptian (4.5%, a difference of 0.070%), Spaniard (4.5%, a difference of 0.11%), Immigrants from Europe (4.5%, a difference of 0.13%), and Immigrants from Egypt (4.5%, a difference of 0.13%).
| Demographics | Rating | Rank | Unemployment Among Ages 45 to 54 years |
| Hungarians | 73.0 /100 | #153 | Good 4.5% |
| Immigrants | Spain | 72.5 /100 | #154 | Good 4.5% |
| Marshallese | 70.6 /100 | #155 | Good 4.5% |
| Immigrants | Croatia | 69.6 /100 | #156 | Good 4.5% |
| Indians (Asian) | 68.1 /100 | #157 | Good 4.5% |
| Immigrants | Italy | 65.5 /100 | #158 | Good 4.5% |
| Immigrants | Nonimmigrants | 62.8 /100 | #159 | Good 4.5% |
| Immigrants | South Eastern Asia | 62.0 /100 | #160 | Good 4.5% |
| Immigrants | Eastern Europe | 61.6 /100 | #161 | Good 4.5% |
| Immigrants | Indonesia | 60.3 /100 | #162 | Good 4.5% |
| Bangladeshis | 59.7 /100 | #163 | Average 4.5% |
| Samoans | 58.5 /100 | #164 | Average 4.5% |
| Maltese | 57.9 /100 | #165 | Average 4.5% |
| Immigrants | Western Europe | 57.4 /100 | #166 | Average 4.5% |
| Immigrants | Brazil | 56.4 /100 | #167 | Average 4.5% |
| Immigrants | Europe | 54.7 /100 | #168 | Average 4.5% |
| Immigrants | Egypt | 54.7 /100 | #169 | Average 4.5% |
| Spaniards | 54.3 /100 | #170 | Average 4.5% |
| Egyptians | 53.6 /100 | #171 | Average 4.5% |
| Colombians | 53.3 /100 | #172 | Average 4.5% |
| Immigrants | Colombia | 52.0 /100 | #173 | Average 4.5% |