Immigrants from Middle Africa vs Immigrants from Colombia Unemployment Among Ages 45 to 54 years
COMPARE
Immigrants from Middle Africa
Immigrants from Colombia
Unemployment Among Ages 45 to 54 years
Unemployment Among Ages 45 to 54 years Comparison
Immigrants from Middle Africa
Immigrants from Colombia
4.4%
UNEMPLOYMENT AMONG AGES 45 TO 54 YEARS
83.3/ 100
METRIC RATING
136th/ 347
METRIC RANK
4.5%
UNEMPLOYMENT AMONG AGES 45 TO 54 YEARS
52.0/ 100
METRIC RATING
173rd/ 347
METRIC RANK
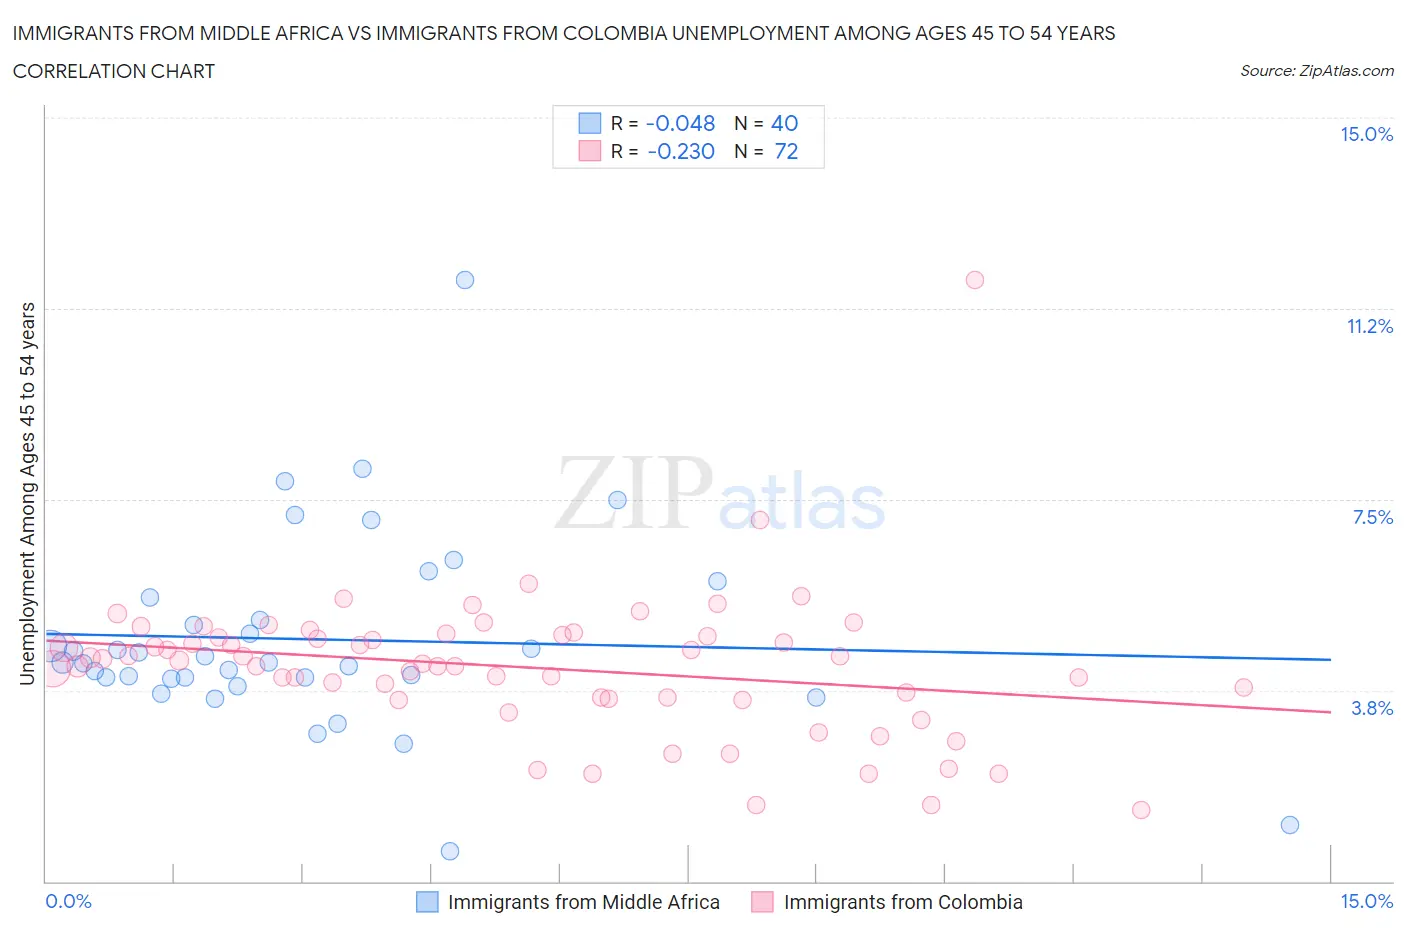
Immigrants from Middle Africa vs Immigrants from Colombia Unemployment Among Ages 45 to 54 years Correlation Chart
The statistical analysis conducted on geographies consisting of 200,641,916 people shows no correlation between the proportion of Immigrants from Middle Africa and unemployment rate among population between the ages 45 and 54 in the United States with a correlation coefficient (R) of -0.048 and weighted average of 4.4%. Similarly, the statistical analysis conducted on geographies consisting of 370,552,146 people shows a weak negative correlation between the proportion of Immigrants from Colombia and unemployment rate among population between the ages 45 and 54 in the United States with a correlation coefficient (R) of -0.230 and weighted average of 4.5%, a difference of 1.8%.
Unemployment Among Ages 45 to 54 years Correlation Summary
| Measurement | Immigrants from Middle Africa | Immigrants from Colombia |
| Minimum | 0.60% | 1.4% |
| Maximum | 11.8% | 11.8% |
| Range | 11.2% | 10.4% |
| Mean | 4.8% | 4.2% |
| Median | 4.3% | 4.3% |
| Interquartile 25% (IQ1) | 4.0% | 3.6% |
| Interquartile 75% (IQ3) | 5.3% | 4.8% |
| Interquartile Range (IQR) | 1.4% | 1.2% |
| Standard Deviation (Sample) | 1.9% | 1.4% |
| Standard Deviation (Population) | 1.9% | 1.4% |
Similar Demographics by Unemployment Among Ages 45 to 54 years
Demographics Similar to Immigrants from Middle Africa by Unemployment Among Ages 45 to 54 years
In terms of unemployment among ages 45 to 54 years, the demographic groups most similar to Immigrants from Middle Africa are Immigrants from Eastern Asia (4.4%, a difference of 0.060%), Afghan (4.4%, a difference of 0.11%), Lebanese (4.4%, a difference of 0.12%), Immigrants from Cameroon (4.4%, a difference of 0.13%), and Immigrants from Congo (4.4%, a difference of 0.13%).
| Demographics | Rating | Rank | Unemployment Among Ages 45 to 54 years |
| Laotians | 86.3 /100 | #129 | Excellent 4.4% |
| Celtics | 86.2 /100 | #130 | Excellent 4.4% |
| Immigrants | Germany | 85.9 /100 | #131 | Excellent 4.4% |
| Immigrants | Eastern Africa | 85.1 /100 | #132 | Excellent 4.4% |
| Immigrants | Cameroon | 84.8 /100 | #133 | Excellent 4.4% |
| Afghans | 84.6 /100 | #134 | Excellent 4.4% |
| Immigrants | Eastern Asia | 84.0 /100 | #135 | Excellent 4.4% |
| Immigrants | Middle Africa | 83.3 /100 | #136 | Excellent 4.4% |
| Lebanese | 81.9 /100 | #137 | Excellent 4.4% |
| Immigrants | Congo | 81.8 /100 | #138 | Excellent 4.4% |
| Immigrants | Kuwait | 81.7 /100 | #139 | Excellent 4.4% |
| Immigrants | Zaire | 80.7 /100 | #140 | Excellent 4.4% |
| Immigrants | Afghanistan | 79.6 /100 | #141 | Good 4.4% |
| Immigrants | Netherlands | 79.4 /100 | #142 | Good 4.4% |
| Macedonians | 79.0 /100 | #143 | Good 4.5% |
Demographics Similar to Immigrants from Colombia by Unemployment Among Ages 45 to 54 years
In terms of unemployment among ages 45 to 54 years, the demographic groups most similar to Immigrants from Colombia are Colombian (4.5%, a difference of 0.060%), Egyptian (4.5%, a difference of 0.070%), Immigrants from Hungary (4.5%, a difference of 0.090%), Spaniard (4.5%, a difference of 0.11%), and Immigrants from France (4.5%, a difference of 0.12%).
| Demographics | Rating | Rank | Unemployment Among Ages 45 to 54 years |
| Immigrants | Western Europe | 57.4 /100 | #166 | Average 4.5% |
| Immigrants | Brazil | 56.4 /100 | #167 | Average 4.5% |
| Immigrants | Europe | 54.7 /100 | #168 | Average 4.5% |
| Immigrants | Egypt | 54.7 /100 | #169 | Average 4.5% |
| Spaniards | 54.3 /100 | #170 | Average 4.5% |
| Egyptians | 53.6 /100 | #171 | Average 4.5% |
| Colombians | 53.3 /100 | #172 | Average 4.5% |
| Immigrants | Colombia | 52.0 /100 | #173 | Average 4.5% |
| Immigrants | Hungary | 50.0 /100 | #174 | Average 4.5% |
| Immigrants | France | 49.4 /100 | #175 | Average 4.5% |
| Puget Sound Salish | 49.1 /100 | #176 | Average 4.5% |
| Immigrants | Northern Africa | 49.0 /100 | #177 | Average 4.5% |
| Immigrants | Australia | 48.5 /100 | #178 | Average 4.5% |
| Immigrants | Russia | 48.2 /100 | #179 | Average 4.5% |
| Malaysians | 47.5 /100 | #180 | Average 4.5% |