Immigrants from Spain vs Chippewa Unemployment Among Ages 45 to 54 years
COMPARE
Immigrants from Spain
Chippewa
Unemployment Among Ages 45 to 54 years
Unemployment Among Ages 45 to 54 years Comparison
Immigrants from Spain
Chippewa
4.5%
UNEMPLOYMENT AMONG AGES 45 TO 54 YEARS
72.5/ 100
METRIC RATING
154th/ 347
METRIC RANK
5.5%
UNEMPLOYMENT AMONG AGES 45 TO 54 YEARS
0.0/ 100
METRIC RATING
311th/ 347
METRIC RANK
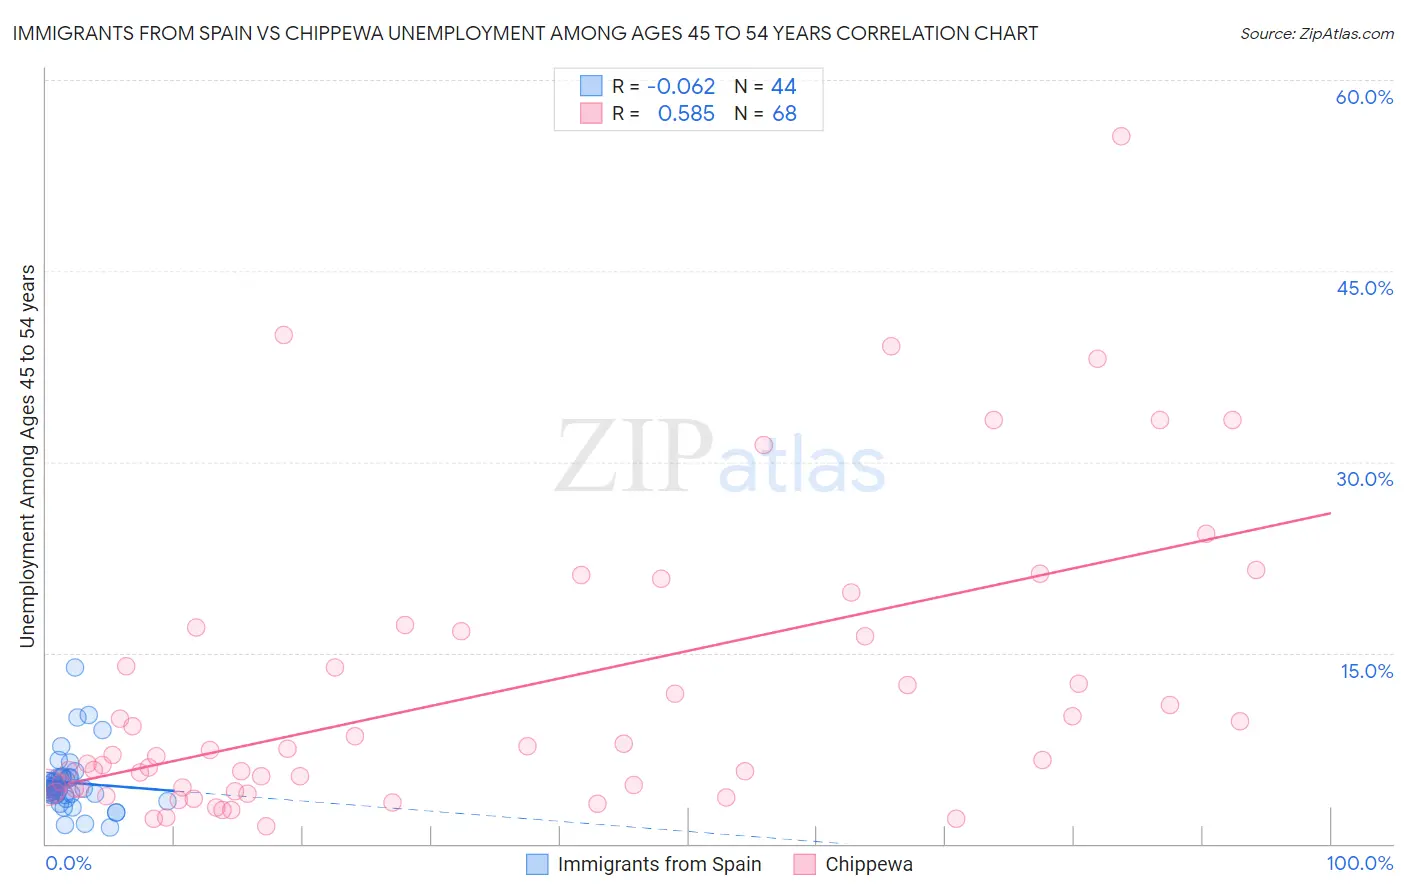
Immigrants from Spain vs Chippewa Unemployment Among Ages 45 to 54 years Correlation Chart
The statistical analysis conducted on geographies consisting of 236,545,897 people shows a slight negative correlation between the proportion of Immigrants from Spain and unemployment rate among population between the ages 45 and 54 in the United States with a correlation coefficient (R) of -0.062 and weighted average of 4.5%. Similarly, the statistical analysis conducted on geographies consisting of 209,787,831 people shows a substantial positive correlation between the proportion of Chippewa and unemployment rate among population between the ages 45 and 54 in the United States with a correlation coefficient (R) of 0.585 and weighted average of 5.5%, a difference of 22.7%.
Unemployment Among Ages 45 to 54 years Correlation Summary
| Measurement | Immigrants from Spain | Chippewa |
| Minimum | 1.3% | 1.4% |
| Maximum | 13.8% | 55.6% |
| Range | 12.5% | 54.2% |
| Mean | 4.8% | 11.9% |
| Median | 4.4% | 6.9% |
| Interquartile 25% (IQ1) | 3.8% | 4.3% |
| Interquartile 75% (IQ3) | 5.2% | 16.5% |
| Interquartile Range (IQR) | 1.4% | 12.2% |
| Standard Deviation (Sample) | 2.3% | 11.4% |
| Standard Deviation (Population) | 2.3% | 11.3% |
Similar Demographics by Unemployment Among Ages 45 to 54 years
Demographics Similar to Immigrants from Spain by Unemployment Among Ages 45 to 54 years
In terms of unemployment among ages 45 to 54 years, the demographic groups most similar to Immigrants from Spain are Korean (4.5%, a difference of 0.030%), Hungarian (4.5%, a difference of 0.030%), Marshallese (4.5%, a difference of 0.11%), Cypriot (4.5%, a difference of 0.12%), and Tsimshian (4.5%, a difference of 0.13%).
| Demographics | Rating | Rank | Unemployment Among Ages 45 to 54 years |
| Uruguayans | 76.9 /100 | #147 | Good 4.5% |
| Immigrants | Austria | 75.3 /100 | #148 | Good 4.5% |
| Costa Ricans | 75.3 /100 | #149 | Good 4.5% |
| Tsimshian | 74.6 /100 | #150 | Good 4.5% |
| Cypriots | 74.4 /100 | #151 | Good 4.5% |
| Koreans | 73.1 /100 | #152 | Good 4.5% |
| Hungarians | 73.0 /100 | #153 | Good 4.5% |
| Immigrants | Spain | 72.5 /100 | #154 | Good 4.5% |
| Marshallese | 70.6 /100 | #155 | Good 4.5% |
| Immigrants | Croatia | 69.6 /100 | #156 | Good 4.5% |
| Indians (Asian) | 68.1 /100 | #157 | Good 4.5% |
| Immigrants | Italy | 65.5 /100 | #158 | Good 4.5% |
| Immigrants | Nonimmigrants | 62.8 /100 | #159 | Good 4.5% |
| Immigrants | South Eastern Asia | 62.0 /100 | #160 | Good 4.5% |
| Immigrants | Eastern Europe | 61.6 /100 | #161 | Good 4.5% |
Demographics Similar to Chippewa by Unemployment Among Ages 45 to 54 years
In terms of unemployment among ages 45 to 54 years, the demographic groups most similar to Chippewa are Immigrants from Barbados (5.5%, a difference of 0.28%), Barbadian (5.5%, a difference of 0.44%), Black/African American (5.4%, a difference of 1.1%), Immigrants from Grenada (5.6%, a difference of 1.8%), and Vietnamese (5.4%, a difference of 1.8%).
| Demographics | Rating | Rank | Unemployment Among Ages 45 to 54 years |
| Immigrants | Jamaica | 0.0 /100 | #304 | Tragic 5.4% |
| Immigrants | West Indies | 0.0 /100 | #305 | Tragic 5.4% |
| Immigrants | Bangladesh | 0.0 /100 | #306 | Tragic 5.4% |
| Vietnamese | 0.0 /100 | #307 | Tragic 5.4% |
| Blacks/African Americans | 0.0 /100 | #308 | Tragic 5.4% |
| Barbadians | 0.0 /100 | #309 | Tragic 5.5% |
| Immigrants | Barbados | 0.0 /100 | #310 | Tragic 5.5% |
| Chippewa | 0.0 /100 | #311 | Tragic 5.5% |
| Immigrants | Grenada | 0.0 /100 | #312 | Tragic 5.6% |
| Shoshone | 0.0 /100 | #313 | Tragic 5.6% |
| Guyanese | 0.0 /100 | #314 | Tragic 5.6% |
| Immigrants | Dominica | 0.0 /100 | #315 | Tragic 5.6% |
| Immigrants | Guyana | 0.0 /100 | #316 | Tragic 5.6% |
| Houma | 0.0 /100 | #317 | Tragic 5.6% |
| British West Indians | 0.0 /100 | #318 | Tragic 5.7% |