Immigrants from South Eastern Asia vs Bangladeshi Unemployment Among Ages 20 to 24 years
COMPARE
Immigrants from South Eastern Asia
Bangladeshi
Unemployment Among Ages 20 to 24 years
Unemployment Among Ages 20 to 24 years Comparison
Immigrants from South Eastern Asia
Bangladeshis
10.1%
UNEMPLOYMENT AMONG AGES 20 TO 24 YEARS
84.0/ 100
METRIC RATING
132nd/ 347
METRIC RANK
10.0%
UNEMPLOYMENT AMONG AGES 20 TO 24 YEARS
96.9/ 100
METRIC RATING
92nd/ 347
METRIC RANK
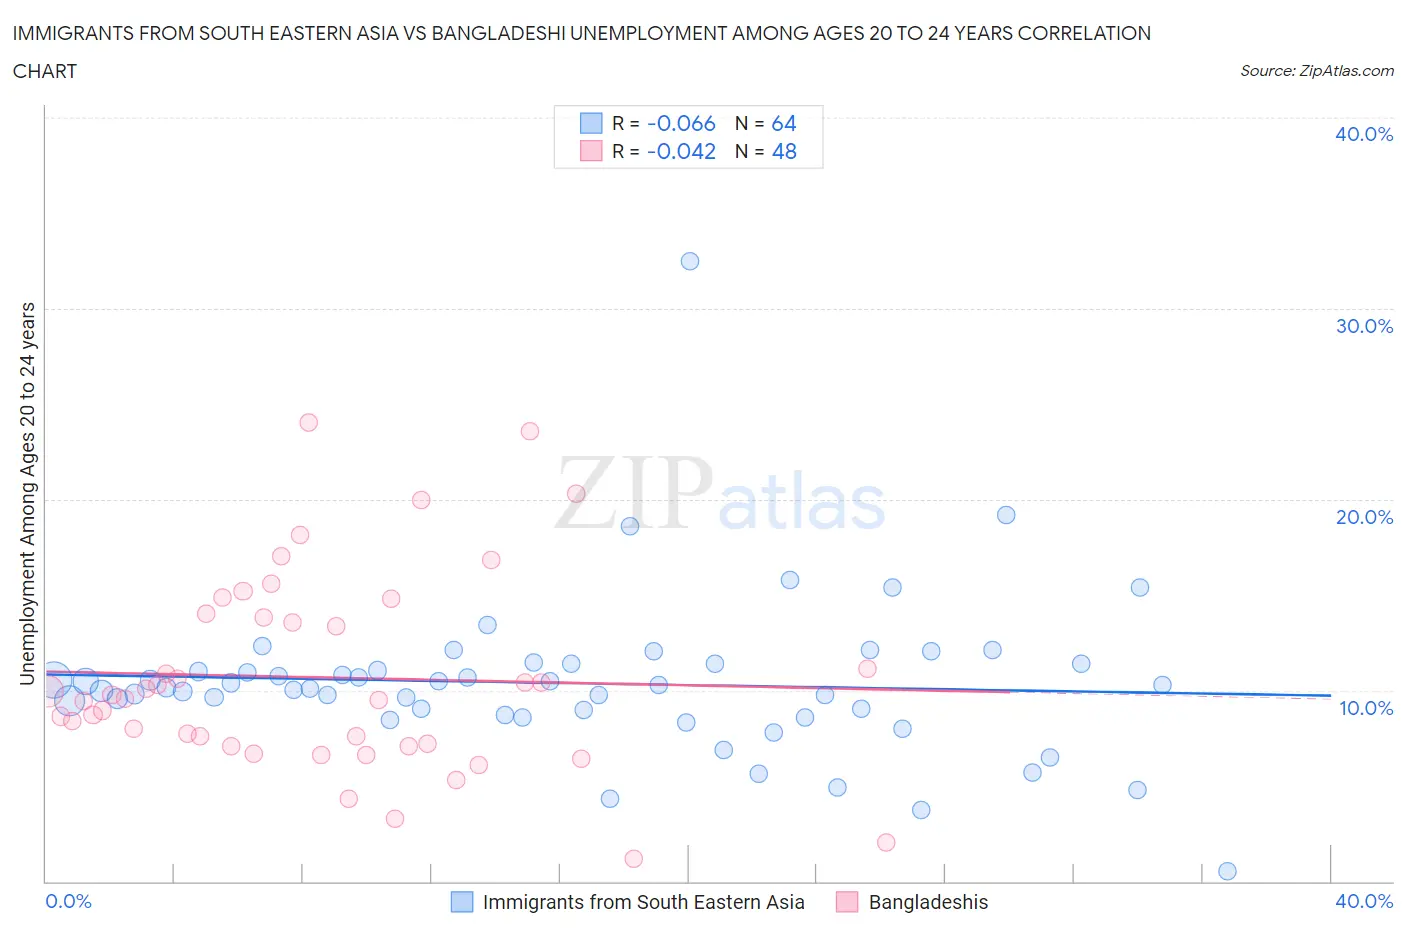
Immigrants from South Eastern Asia vs Bangladeshi Unemployment Among Ages 20 to 24 years Correlation Chart
The statistical analysis conducted on geographies consisting of 486,283,362 people shows a slight negative correlation between the proportion of Immigrants from South Eastern Asia and unemployment rate among population between the ages 20 and 24 in the United States with a correlation coefficient (R) of -0.066 and weighted average of 10.1%. Similarly, the statistical analysis conducted on geographies consisting of 139,664,928 people shows no correlation between the proportion of Bangladeshis and unemployment rate among population between the ages 20 and 24 in the United States with a correlation coefficient (R) of -0.042 and weighted average of 10.0%, a difference of 1.7%.
Unemployment Among Ages 20 to 24 years Correlation Summary
| Measurement | Immigrants from South Eastern Asia | Bangladeshi |
| Minimum | 0.50% | 1.2% |
| Maximum | 32.5% | 24.0% |
| Range | 32.0% | 22.8% |
| Mean | 10.4% | 10.7% |
| Median | 10.2% | 9.7% |
| Interquartile 25% (IQ1) | 8.8% | 7.2% |
| Interquartile 75% (IQ3) | 11.4% | 13.9% |
| Interquartile Range (IQR) | 2.6% | 6.8% |
| Standard Deviation (Sample) | 4.2% | 5.1% |
| Standard Deviation (Population) | 4.1% | 5.1% |
Similar Demographics by Unemployment Among Ages 20 to 24 years
Demographics Similar to Immigrants from South Eastern Asia by Unemployment Among Ages 20 to 24 years
In terms of unemployment among ages 20 to 24 years, the demographic groups most similar to Immigrants from South Eastern Asia are Immigrants from Lithuania (10.1%, a difference of 0.010%), Seminole (10.1%, a difference of 0.010%), Austrian (10.2%, a difference of 0.010%), Romanian (10.2%, a difference of 0.020%), and Immigrants from South Central Asia (10.1%, a difference of 0.040%).
| Demographics | Rating | Rank | Unemployment Among Ages 20 to 24 years |
| Spanish | 86.1 /100 | #125 | Excellent 10.1% |
| Jordanians | 86.1 /100 | #126 | Excellent 10.1% |
| Immigrants | Norway | 85.3 /100 | #127 | Excellent 10.1% |
| Immigrants | Brazil | 84.9 /100 | #128 | Excellent 10.1% |
| Immigrants | South Central Asia | 84.6 /100 | #129 | Excellent 10.1% |
| Immigrants | Lithuania | 84.2 /100 | #130 | Excellent 10.1% |
| Seminole | 84.2 /100 | #131 | Excellent 10.1% |
| Immigrants | South Eastern Asia | 84.0 /100 | #132 | Excellent 10.1% |
| Austrians | 83.9 /100 | #133 | Excellent 10.2% |
| Romanians | 83.8 /100 | #134 | Excellent 10.2% |
| Comanche | 83.4 /100 | #135 | Excellent 10.2% |
| Immigrants | Northern Africa | 82.5 /100 | #136 | Excellent 10.2% |
| Immigrants | North America | 82.5 /100 | #137 | Excellent 10.2% |
| Burmese | 82.3 /100 | #138 | Excellent 10.2% |
| Uruguayans | 81.9 /100 | #139 | Excellent 10.2% |
Demographics Similar to Bangladeshis by Unemployment Among Ages 20 to 24 years
In terms of unemployment among ages 20 to 24 years, the demographic groups most similar to Bangladeshis are Bhutanese (10.0%, a difference of 0.010%), Immigrants from Malaysia (10.0%, a difference of 0.010%), Macedonian (10.0%, a difference of 0.040%), Chilean (10.0%, a difference of 0.040%), and Polish (10.0%, a difference of 0.060%).
| Demographics | Rating | Rank | Unemployment Among Ages 20 to 24 years |
| New Zealanders | 97.8 /100 | #85 | Exceptional 9.9% |
| Immigrants | Vietnam | 97.5 /100 | #86 | Exceptional 10.0% |
| Immigrants | Oceania | 97.4 /100 | #87 | Exceptional 10.0% |
| Poles | 97.1 /100 | #88 | Exceptional 10.0% |
| Macedonians | 97.0 /100 | #89 | Exceptional 10.0% |
| Chileans | 97.0 /100 | #90 | Exceptional 10.0% |
| Bhutanese | 96.9 /100 | #91 | Exceptional 10.0% |
| Bangladeshis | 96.9 /100 | #92 | Exceptional 10.0% |
| Immigrants | Malaysia | 96.9 /100 | #93 | Exceptional 10.0% |
| Immigrants | Micronesia | 96.6 /100 | #94 | Exceptional 10.0% |
| Scotch-Irish | 96.2 /100 | #95 | Exceptional 10.0% |
| Thais | 96.2 /100 | #96 | Exceptional 10.0% |
| Slavs | 96.1 /100 | #97 | Exceptional 10.0% |
| Japanese | 95.4 /100 | #98 | Exceptional 10.0% |
| Fijians | 95.3 /100 | #99 | Exceptional 10.0% |