Bolivian vs Bangladeshi Unemployment Among Ages 20 to 24 years
COMPARE
Bolivian
Bangladeshi
Unemployment Among Ages 20 to 24 years
Unemployment Among Ages 20 to 24 years Comparison
Bolivians
Bangladeshis
9.9%
UNEMPLOYMENT AMONG AGES 20 TO 24 YEARS
98.9/ 100
METRIC RATING
72nd/ 347
METRIC RANK
10.0%
UNEMPLOYMENT AMONG AGES 20 TO 24 YEARS
96.9/ 100
METRIC RATING
92nd/ 347
METRIC RANK
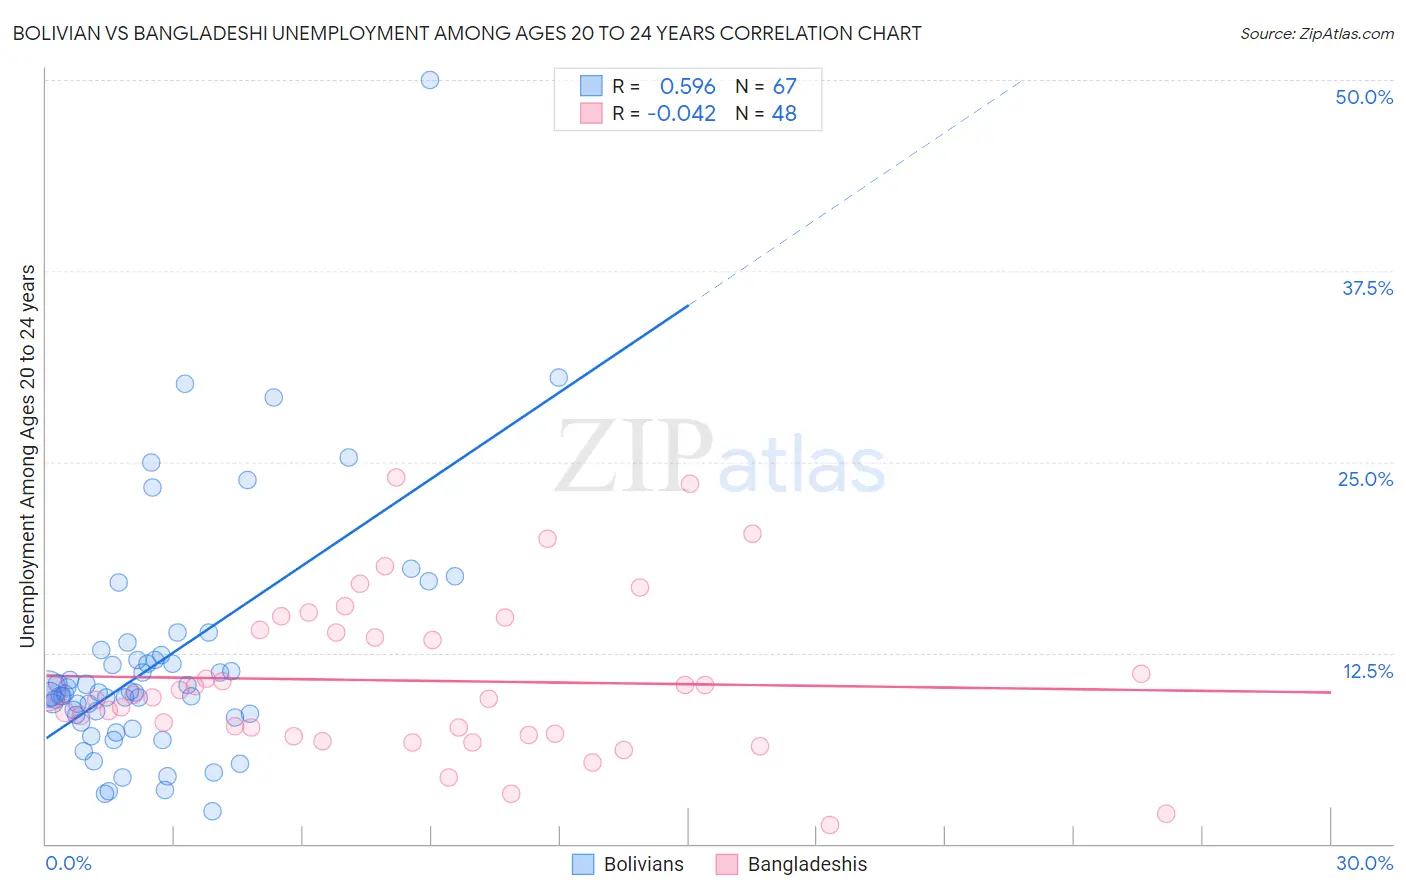
Bolivian vs Bangladeshi Unemployment Among Ages 20 to 24 years Correlation Chart
The statistical analysis conducted on geographies consisting of 182,628,863 people shows a substantial positive correlation between the proportion of Bolivians and unemployment rate among population between the ages 20 and 24 in the United States with a correlation coefficient (R) of 0.596 and weighted average of 9.9%. Similarly, the statistical analysis conducted on geographies consisting of 139,664,928 people shows no correlation between the proportion of Bangladeshis and unemployment rate among population between the ages 20 and 24 in the United States with a correlation coefficient (R) of -0.042 and weighted average of 10.0%, a difference of 0.98%.
Unemployment Among Ages 20 to 24 years Correlation Summary
| Measurement | Bolivian | Bangladeshi |
| Minimum | 2.1% | 1.2% |
| Maximum | 50.0% | 24.0% |
| Range | 47.9% | 22.8% |
| Mean | 12.0% | 10.7% |
| Median | 9.9% | 9.7% |
| Interquartile 25% (IQ1) | 8.3% | 7.2% |
| Interquartile 75% (IQ3) | 12.4% | 13.9% |
| Interquartile Range (IQR) | 4.1% | 6.8% |
| Standard Deviation (Sample) | 7.9% | 5.1% |
| Standard Deviation (Population) | 7.8% | 5.1% |
Demographics Similar to Bolivians and Bangladeshis by Unemployment Among Ages 20 to 24 years
In terms of unemployment among ages 20 to 24 years, the demographic groups most similar to Bolivians are Kenyan (9.9%, a difference of 0.14%), Immigrants from Laos (9.9%, a difference of 0.17%), Immigrants from Australia (9.9%, a difference of 0.24%), Czechoslovakian (9.9%, a difference of 0.33%), and Chickasaw (9.9%, a difference of 0.35%). Similarly, the demographic groups most similar to Bangladeshis are Bhutanese (10.0%, a difference of 0.010%), Macedonian (10.0%, a difference of 0.040%), Chilean (10.0%, a difference of 0.040%), Polish (10.0%, a difference of 0.060%), and Immigrants from Oceania (10.0%, a difference of 0.15%).
| Demographics | Rating | Rank | Unemployment Among Ages 20 to 24 years |
| Bolivians | 98.9 /100 | #72 | Exceptional 9.9% |
| Kenyans | 98.7 /100 | #73 | Exceptional 9.9% |
| Immigrants | Laos | 98.7 /100 | #74 | Exceptional 9.9% |
| Immigrants | Australia | 98.6 /100 | #75 | Exceptional 9.9% |
| Czechoslovakians | 98.4 /100 | #76 | Exceptional 9.9% |
| Chickasaw | 98.4 /100 | #77 | Exceptional 9.9% |
| Assyrians/Chaldeans/Syriacs | 98.3 /100 | #78 | Exceptional 9.9% |
| Icelanders | 98.3 /100 | #79 | Exceptional 9.9% |
| Immigrants | Netherlands | 98.2 /100 | #80 | Exceptional 9.9% |
| Yaqui | 98.0 /100 | #81 | Exceptional 9.9% |
| Sri Lankans | 98.0 /100 | #82 | Exceptional 9.9% |
| Immigrants | Bulgaria | 98.0 /100 | #83 | Exceptional 9.9% |
| Latvians | 97.9 /100 | #84 | Exceptional 9.9% |
| New Zealanders | 97.8 /100 | #85 | Exceptional 9.9% |
| Immigrants | Vietnam | 97.5 /100 | #86 | Exceptional 10.0% |
| Immigrants | Oceania | 97.4 /100 | #87 | Exceptional 10.0% |
| Poles | 97.1 /100 | #88 | Exceptional 10.0% |
| Macedonians | 97.0 /100 | #89 | Exceptional 10.0% |
| Chileans | 97.0 /100 | #90 | Exceptional 10.0% |
| Bhutanese | 96.9 /100 | #91 | Exceptional 10.0% |
| Bangladeshis | 96.9 /100 | #92 | Exceptional 10.0% |