Arapaho vs Northern European Unemployment Among Ages 30 to 34 years
COMPARE
Arapaho
Northern European
Unemployment Among Ages 30 to 34 years
Unemployment Among Ages 30 to 34 years Comparison
Arapaho
Northern Europeans
12.8%
UNEMPLOYMENT AMONG AGES 30 TO 34 YEARS
0.0/ 100
METRIC RATING
345th/ 347
METRIC RANK
5.3%
UNEMPLOYMENT AMONG AGES 30 TO 34 YEARS
87.9/ 100
METRIC RATING
104th/ 347
METRIC RANK
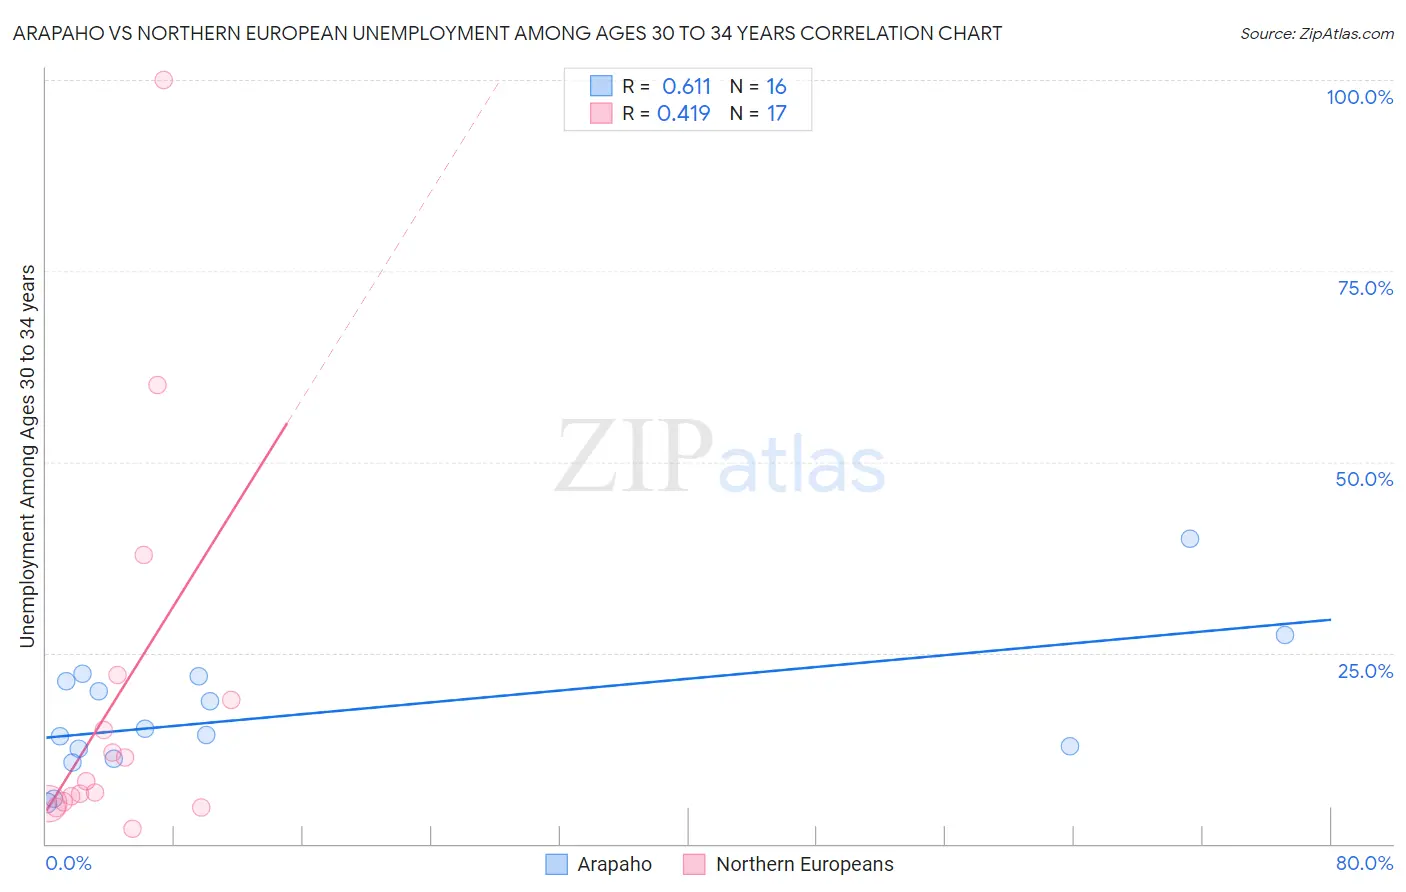
Arapaho vs Northern European Unemployment Among Ages 30 to 34 years Correlation Chart
The statistical analysis conducted on geographies consisting of 29,209,448 people shows a significant positive correlation between the proportion of Arapaho and unemployment rate among population between the ages 30 and 34 in the United States with a correlation coefficient (R) of 0.611 and weighted average of 12.8%. Similarly, the statistical analysis conducted on geographies consisting of 375,306,906 people shows a moderate positive correlation between the proportion of Northern Europeans and unemployment rate among population between the ages 30 and 34 in the United States with a correlation coefficient (R) of 0.419 and weighted average of 5.3%, a difference of 143.1%.
Unemployment Among Ages 30 to 34 years Correlation Summary
| Measurement | Arapaho | Northern European |
| Minimum | 5.3% | 1.9% |
| Maximum | 40.0% | 100.0% |
| Range | 34.7% | 98.1% |
| Mean | 17.1% | 19.2% |
| Median | 14.6% | 8.2% |
| Interquartile 25% (IQ1) | 11.8% | 5.4% |
| Interquartile 75% (IQ3) | 21.6% | 20.5% |
| Interquartile Range (IQR) | 9.8% | 15.1% |
| Standard Deviation (Sample) | 8.6% | 25.5% |
| Standard Deviation (Population) | 8.3% | 24.7% |
Similar Demographics by Unemployment Among Ages 30 to 34 years
Demographics Similar to Arapaho by Unemployment Among Ages 30 to 34 years
In terms of unemployment among ages 30 to 34 years, the demographic groups most similar to Arapaho are Tsimshian (13.8%, a difference of 7.4%), Hopi (11.9%, a difference of 7.4%), Inupiat (10.8%, a difference of 18.5%), Yuman (10.6%, a difference of 21.0%), and Navajo (10.6%, a difference of 21.5%).
| Demographics | Rating | Rank | Unemployment Among Ages 30 to 34 years |
| Pueblo | 0.0 /100 | #333 | Tragic 8.3% |
| Alaska Natives | 0.0 /100 | #334 | Tragic 8.5% |
| Puerto Ricans | 0.0 /100 | #335 | Tragic 8.9% |
| Colville | 0.0 /100 | #336 | Tragic 9.0% |
| Pima | 0.0 /100 | #337 | Tragic 9.6% |
| Yakama | 0.0 /100 | #338 | Tragic 9.8% |
| Tohono O'odham | 0.0 /100 | #339 | Tragic 9.8% |
| Crow | 0.0 /100 | #340 | Tragic 10.3% |
| Navajo | 0.0 /100 | #341 | Tragic 10.6% |
| Yuman | 0.0 /100 | #342 | Tragic 10.6% |
| Inupiat | 0.0 /100 | #343 | Tragic 10.8% |
| Hopi | 0.0 /100 | #344 | Tragic 11.9% |
| Arapaho | 0.0 /100 | #345 | Tragic 12.8% |
| Tsimshian | 0.0 /100 | #346 | Tragic 13.8% |
| Yup'ik | 0.0 /100 | #347 | Tragic 18.5% |
Demographics Similar to Northern Europeans by Unemployment Among Ages 30 to 34 years
In terms of unemployment among ages 30 to 34 years, the demographic groups most similar to Northern Europeans are Argentinean (5.3%, a difference of 0.0%), Croatian (5.3%, a difference of 0.050%), Icelander (5.3%, a difference of 0.12%), Immigrants from Middle Africa (5.3%, a difference of 0.12%), and Immigrants from Jordan (5.3%, a difference of 0.16%).
| Demographics | Rating | Rank | Unemployment Among Ages 30 to 34 years |
| Europeans | 91.7 /100 | #97 | Exceptional 5.2% |
| Immigrants | North Macedonia | 90.9 /100 | #98 | Exceptional 5.2% |
| Immigrants | Ireland | 90.6 /100 | #99 | Exceptional 5.2% |
| Immigrants | Czechoslovakia | 89.5 /100 | #100 | Excellent 5.3% |
| British | 89.1 /100 | #101 | Excellent 5.3% |
| Immigrants | Switzerland | 88.8 /100 | #102 | Excellent 5.3% |
| Immigrants | Jordan | 88.8 /100 | #103 | Excellent 5.3% |
| Northern Europeans | 87.9 /100 | #104 | Excellent 5.3% |
| Argentineans | 87.9 /100 | #105 | Excellent 5.3% |
| Croatians | 87.6 /100 | #106 | Excellent 5.3% |
| Icelanders | 87.2 /100 | #107 | Excellent 5.3% |
| Immigrants | Middle Africa | 87.1 /100 | #108 | Excellent 5.3% |
| Immigrants | Chile | 86.7 /100 | #109 | Excellent 5.3% |
| Egyptians | 86.4 /100 | #110 | Excellent 5.3% |
| Immigrants | Pakistan | 86.2 /100 | #111 | Excellent 5.3% |