Immigrants from Singapore vs Seminole Unemployment Among Seniors over 65 years
COMPARE
Immigrants from Singapore
Seminole
Unemployment Among Seniors over 65 years
Unemployment Among Seniors over 65 years Comparison
Immigrants from Singapore
Seminole
5.0%
UNEMPLOYMENT AMONG SENIORS OVER 65 YEARS
96.8/ 100
METRIC RATING
96th/ 347
METRIC RANK
5.0%
UNEMPLOYMENT AMONG SENIORS OVER 65 YEARS
91.4/ 100
METRIC RATING
113th/ 347
METRIC RANK
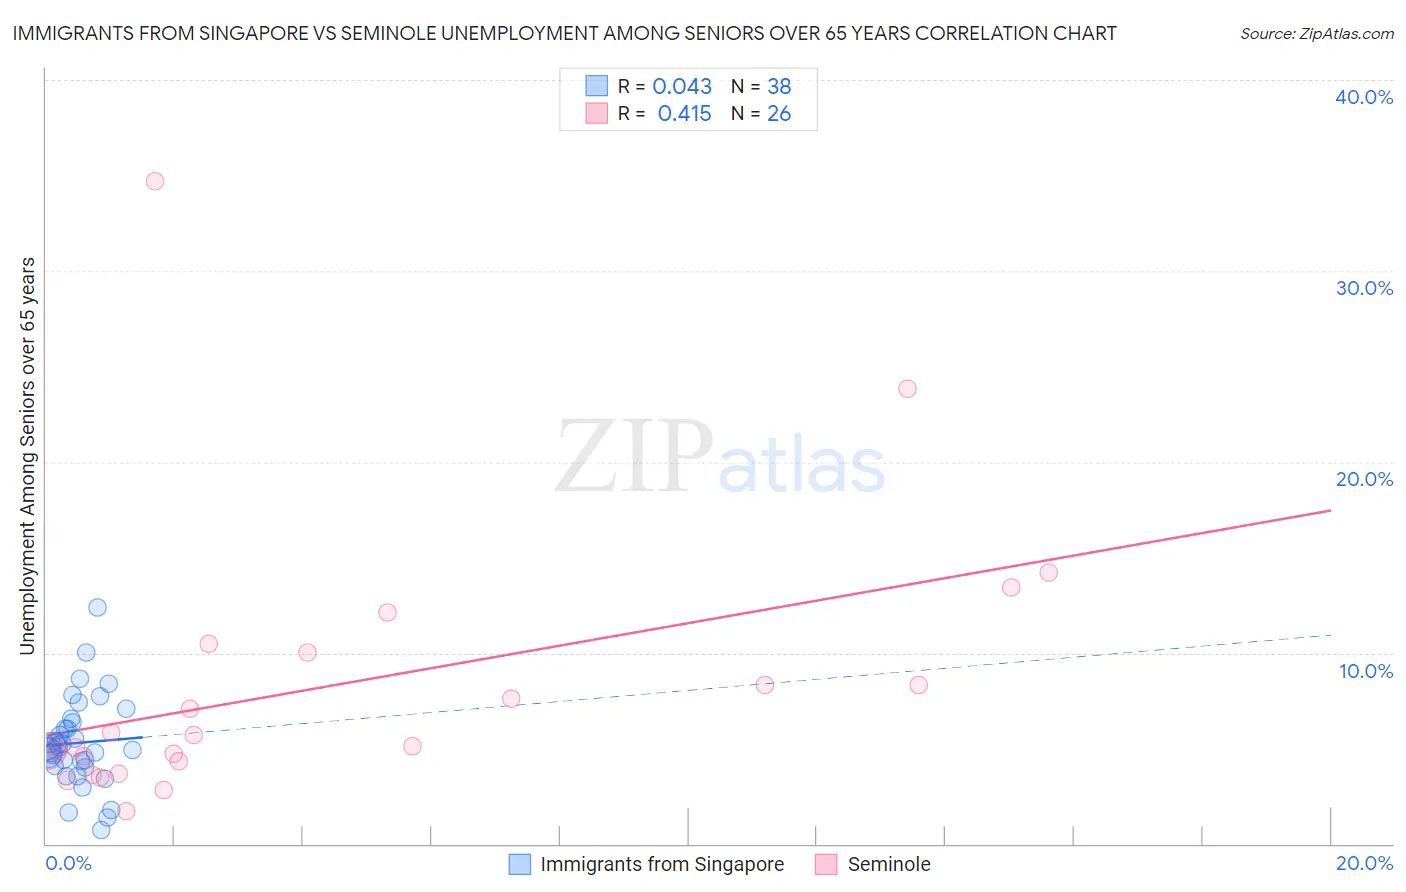
Immigrants from Singapore vs Seminole Unemployment Among Seniors over 65 years Correlation Chart
The statistical analysis conducted on geographies consisting of 132,659,139 people shows no correlation between the proportion of Immigrants from Singapore and unemployment rate amomg seniors over the age of 65 in the United States with a correlation coefficient (R) of 0.043 and weighted average of 5.0%. Similarly, the statistical analysis conducted on geographies consisting of 112,443,018 people shows a moderate positive correlation between the proportion of Seminole and unemployment rate amomg seniors over the age of 65 in the United States with a correlation coefficient (R) of 0.415 and weighted average of 5.0%, a difference of 0.85%.
Unemployment Among Seniors over 65 years Correlation Summary
| Measurement | Immigrants from Singapore | Seminole |
| Minimum | 0.70% | 1.7% |
| Maximum | 12.4% | 34.7% |
| Range | 11.7% | 33.0% |
| Mean | 5.3% | 8.2% |
| Median | 5.0% | 5.4% |
| Interquartile 25% (IQ1) | 4.1% | 4.3% |
| Interquartile 75% (IQ3) | 6.4% | 10.0% |
| Interquartile Range (IQR) | 2.3% | 5.7% |
| Standard Deviation (Sample) | 2.3% | 7.2% |
| Standard Deviation (Population) | 2.3% | 7.0% |
Demographics Similar to Immigrants from Singapore and Seminole by Unemployment Among Seniors over 65 years
In terms of unemployment among seniors over 65 years, the demographic groups most similar to Immigrants from Singapore are Assyrian/Chaldean/Syriac (5.0%, a difference of 0.0%), Immigrants from Oceania (5.0%, a difference of 0.0%), Czechoslovakian (5.0%, a difference of 0.010%), Burmese (5.0%, a difference of 0.020%), and South African (5.0%, a difference of 0.060%). Similarly, the demographic groups most similar to Seminole are Immigrants from Latvia (5.0%, a difference of 0.0%), Eastern European (5.0%, a difference of 0.060%), Finnish (5.0%, a difference of 0.080%), Immigrants from Saudi Arabia (5.0%, a difference of 0.14%), and Immigrants from Malaysia (5.0%, a difference of 0.15%).
| Demographics | Rating | Rank | Unemployment Among Seniors over 65 years |
| Burmese | 96.8 /100 | #94 | Exceptional 5.0% |
| Assyrians/Chaldeans/Syriacs | 96.8 /100 | #95 | Exceptional 5.0% |
| Immigrants | Singapore | 96.8 /100 | #96 | Exceptional 5.0% |
| Immigrants | Oceania | 96.8 /100 | #97 | Exceptional 5.0% |
| Czechoslovakians | 96.7 /100 | #98 | Exceptional 5.0% |
| South Africans | 96.5 /100 | #99 | Exceptional 5.0% |
| Romanians | 95.5 /100 | #100 | Exceptional 5.0% |
| Yugoslavians | 95.4 /100 | #101 | Exceptional 5.0% |
| Immigrants | Thailand | 95.4 /100 | #102 | Exceptional 5.0% |
| Immigrants | Lithuania | 95.1 /100 | #103 | Exceptional 5.0% |
| Immigrants | Scotland | 95.0 /100 | #104 | Exceptional 5.0% |
| Okinawans | 94.7 /100 | #105 | Exceptional 5.0% |
| Immigrants | Turkey | 94.3 /100 | #106 | Exceptional 5.0% |
| Immigrants | Germany | 93.2 /100 | #107 | Exceptional 5.0% |
| Immigrants | Vietnam | 92.9 /100 | #108 | Exceptional 5.0% |
| Immigrants | Malaysia | 92.7 /100 | #109 | Exceptional 5.0% |
| Immigrants | Saudi Arabia | 92.7 /100 | #110 | Exceptional 5.0% |
| Finns | 92.2 /100 | #111 | Exceptional 5.0% |
| Eastern Europeans | 92.0 /100 | #112 | Exceptional 5.0% |
| Seminole | 91.4 /100 | #113 | Exceptional 5.0% |
| Immigrants | Latvia | 91.4 /100 | #114 | Exceptional 5.0% |