Immigrants from Singapore vs Israeli Unemployment Among Seniors over 65 years
COMPARE
Immigrants from Singapore
Israeli
Unemployment Among Seniors over 65 years
Unemployment Among Seniors over 65 years Comparison
Immigrants from Singapore
Israelis
5.0%
UNEMPLOYMENT AMONG SENIORS OVER 65 YEARS
96.8/ 100
METRIC RATING
96th/ 347
METRIC RANK
5.3%
UNEMPLOYMENT AMONG SENIORS OVER 65 YEARS
6.2/ 100
METRIC RATING
222nd/ 347
METRIC RANK
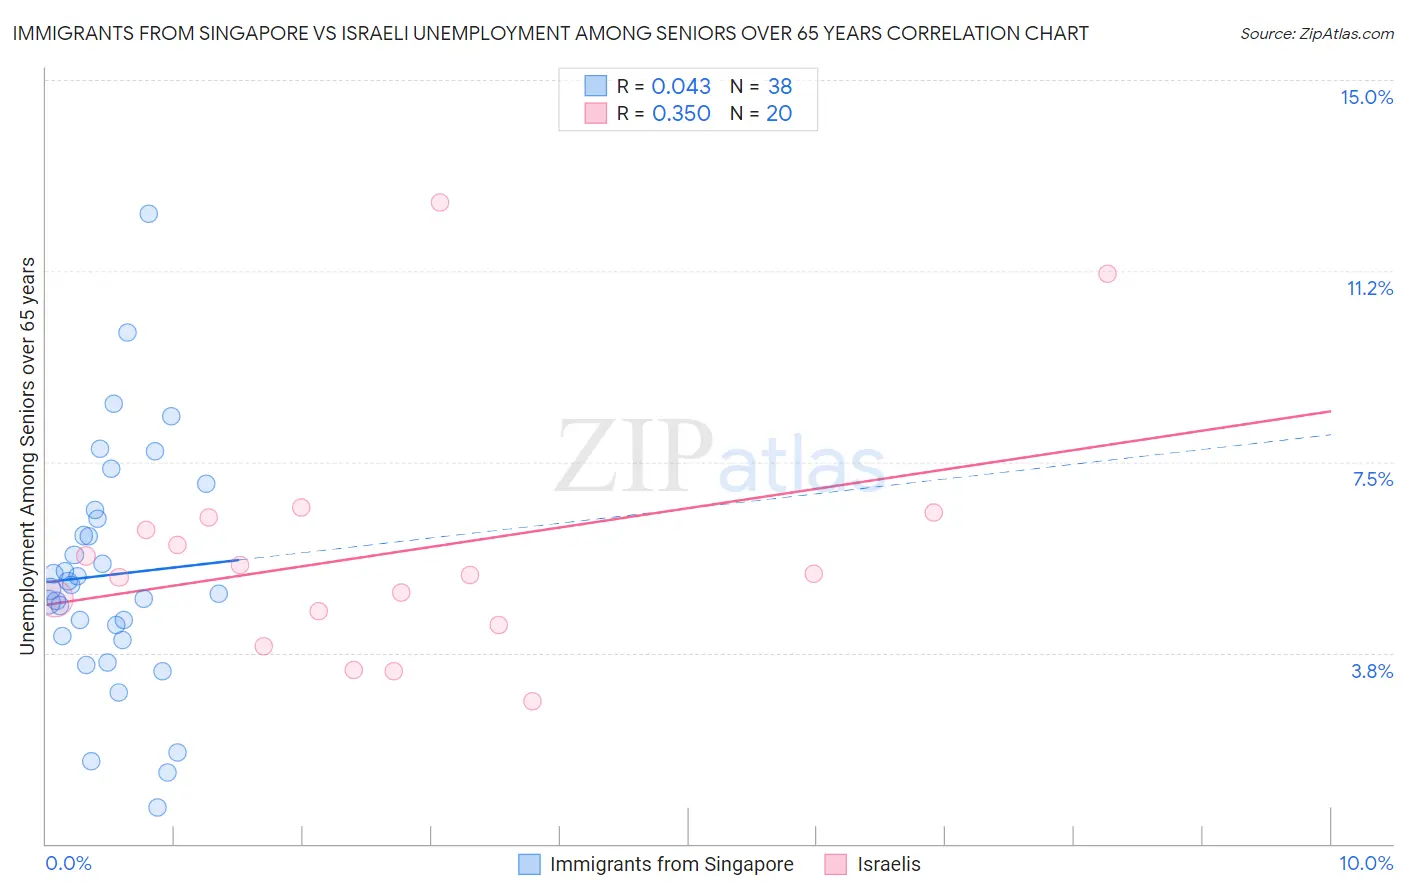
Immigrants from Singapore vs Israeli Unemployment Among Seniors over 65 years Correlation Chart
The statistical analysis conducted on geographies consisting of 132,659,139 people shows no correlation between the proportion of Immigrants from Singapore and unemployment rate amomg seniors over the age of 65 in the United States with a correlation coefficient (R) of 0.043 and weighted average of 5.0%. Similarly, the statistical analysis conducted on geographies consisting of 200,911,105 people shows a mild positive correlation between the proportion of Israelis and unemployment rate amomg seniors over the age of 65 in the United States with a correlation coefficient (R) of 0.350 and weighted average of 5.3%, a difference of 5.0%.
Unemployment Among Seniors over 65 years Correlation Summary
| Measurement | Immigrants from Singapore | Israeli |
| Minimum | 0.70% | 2.8% |
| Maximum | 12.4% | 12.6% |
| Range | 11.7% | 9.8% |
| Mean | 5.3% | 5.7% |
| Median | 5.0% | 5.3% |
| Interquartile 25% (IQ1) | 4.1% | 4.4% |
| Interquartile 75% (IQ3) | 6.4% | 6.3% |
| Interquartile Range (IQR) | 2.3% | 1.9% |
| Standard Deviation (Sample) | 2.3% | 2.4% |
| Standard Deviation (Population) | 2.3% | 2.3% |
Similar Demographics by Unemployment Among Seniors over 65 years
Demographics Similar to Immigrants from Singapore by Unemployment Among Seniors over 65 years
In terms of unemployment among seniors over 65 years, the demographic groups most similar to Immigrants from Singapore are Assyrian/Chaldean/Syriac (5.0%, a difference of 0.0%), Immigrants from Oceania (5.0%, a difference of 0.0%), Czechoslovakian (5.0%, a difference of 0.010%), Burmese (5.0%, a difference of 0.020%), and South African (5.0%, a difference of 0.060%).
| Demographics | Rating | Rank | Unemployment Among Seniors over 65 years |
| Immigrants | South Central Asia | 97.6 /100 | #89 | Exceptional 5.0% |
| Immigrants | South Africa | 97.6 /100 | #90 | Exceptional 5.0% |
| Immigrants | Bolivia | 97.3 /100 | #91 | Exceptional 5.0% |
| Immigrants | Bulgaria | 97.3 /100 | #92 | Exceptional 5.0% |
| Austrians | 97.3 /100 | #93 | Exceptional 5.0% |
| Burmese | 96.8 /100 | #94 | Exceptional 5.0% |
| Assyrians/Chaldeans/Syriacs | 96.8 /100 | #95 | Exceptional 5.0% |
| Immigrants | Singapore | 96.8 /100 | #96 | Exceptional 5.0% |
| Immigrants | Oceania | 96.8 /100 | #97 | Exceptional 5.0% |
| Czechoslovakians | 96.7 /100 | #98 | Exceptional 5.0% |
| South Africans | 96.5 /100 | #99 | Exceptional 5.0% |
| Romanians | 95.5 /100 | #100 | Exceptional 5.0% |
| Yugoslavians | 95.4 /100 | #101 | Exceptional 5.0% |
| Immigrants | Thailand | 95.4 /100 | #102 | Exceptional 5.0% |
| Immigrants | Lithuania | 95.1 /100 | #103 | Exceptional 5.0% |
Demographics Similar to Israelis by Unemployment Among Seniors over 65 years
In terms of unemployment among seniors over 65 years, the demographic groups most similar to Israelis are Egyptian (5.3%, a difference of 0.020%), Arapaho (5.3%, a difference of 0.020%), Cree (5.3%, a difference of 0.060%), Dutch West Indian (5.3%, a difference of 0.080%), and Immigrants from Syria (5.3%, a difference of 0.080%).
| Demographics | Rating | Rank | Unemployment Among Seniors over 65 years |
| Immigrants | Fiji | 8.6 /100 | #215 | Tragic 5.2% |
| Cajuns | 8.5 /100 | #216 | Tragic 5.2% |
| Italians | 8.3 /100 | #217 | Tragic 5.2% |
| Spaniards | 7.4 /100 | #218 | Tragic 5.2% |
| Dutch West Indians | 6.9 /100 | #219 | Tragic 5.3% |
| Egyptians | 6.4 /100 | #220 | Tragic 5.3% |
| Arapaho | 6.3 /100 | #221 | Tragic 5.3% |
| Israelis | 6.2 /100 | #222 | Tragic 5.3% |
| Cree | 5.8 /100 | #223 | Tragic 5.3% |
| Immigrants | Syria | 5.6 /100 | #224 | Tragic 5.3% |
| Hondurans | 5.6 /100 | #225 | Tragic 5.3% |
| Immigrants | Croatia | 5.3 /100 | #226 | Tragic 5.3% |
| French American Indians | 5.2 /100 | #227 | Tragic 5.3% |
| Haitians | 4.4 /100 | #228 | Tragic 5.3% |
| Samoans | 4.2 /100 | #229 | Tragic 5.3% |