Immigrants from Uzbekistan vs Israeli Unemployment Among Seniors over 65 years
COMPARE
Immigrants from Uzbekistan
Israeli
Unemployment Among Seniors over 65 years
Unemployment Among Seniors over 65 years Comparison
Immigrants from Uzbekistan
Israelis
5.2%
UNEMPLOYMENT AMONG SENIORS OVER 65 YEARS
10.7/ 100
METRIC RATING
210th/ 347
METRIC RANK
5.3%
UNEMPLOYMENT AMONG SENIORS OVER 65 YEARS
6.2/ 100
METRIC RATING
222nd/ 347
METRIC RANK
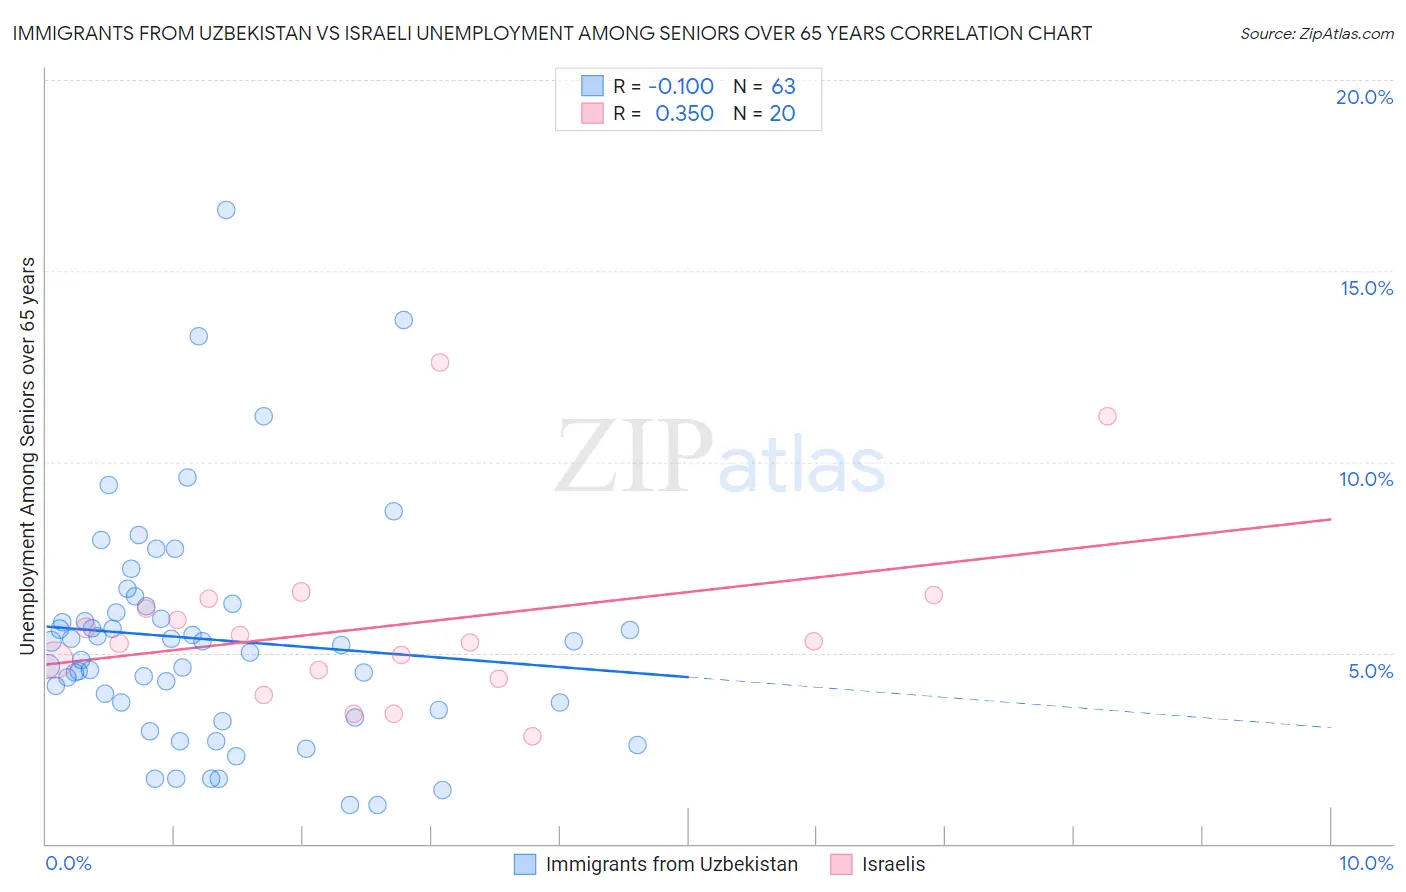
Immigrants from Uzbekistan vs Israeli Unemployment Among Seniors over 65 years Correlation Chart
The statistical analysis conducted on geographies consisting of 115,415,286 people shows a slight negative correlation between the proportion of Immigrants from Uzbekistan and unemployment rate amomg seniors over the age of 65 in the United States with a correlation coefficient (R) of -0.100 and weighted average of 5.2%. Similarly, the statistical analysis conducted on geographies consisting of 200,911,105 people shows a mild positive correlation between the proportion of Israelis and unemployment rate amomg seniors over the age of 65 in the United States with a correlation coefficient (R) of 0.350 and weighted average of 5.3%, a difference of 0.47%.
Unemployment Among Seniors over 65 years Correlation Summary
| Measurement | Immigrants from Uzbekistan | Israeli |
| Minimum | 1.0% | 2.8% |
| Maximum | 16.6% | 12.6% |
| Range | 15.6% | 9.8% |
| Mean | 5.4% | 5.7% |
| Median | 5.2% | 5.3% |
| Interquartile 25% (IQ1) | 3.5% | 4.4% |
| Interquartile 75% (IQ3) | 6.2% | 6.3% |
| Interquartile Range (IQR) | 2.7% | 1.9% |
| Standard Deviation (Sample) | 3.0% | 2.4% |
| Standard Deviation (Population) | 3.0% | 2.3% |
Demographics Similar to Immigrants from Uzbekistan and Israelis by Unemployment Among Seniors over 65 years
In terms of unemployment among seniors over 65 years, the demographic groups most similar to Immigrants from Uzbekistan are African (5.2%, a difference of 0.030%), Immigrants from Honduras (5.2%, a difference of 0.040%), Alsatian (5.2%, a difference of 0.050%), Immigrants from Uruguay (5.2%, a difference of 0.12%), and Uruguayan (5.2%, a difference of 0.14%). Similarly, the demographic groups most similar to Israelis are Egyptian (5.3%, a difference of 0.020%), Arapaho (5.3%, a difference of 0.020%), Cree (5.3%, a difference of 0.060%), Dutch West Indian (5.3%, a difference of 0.080%), and Immigrants from Syria (5.3%, a difference of 0.080%).
| Demographics | Rating | Rank | Unemployment Among Seniors over 65 years |
| German Russians | 14.7 /100 | #206 | Poor 5.2% |
| Immigrants | Philippines | 13.2 /100 | #207 | Poor 5.2% |
| Uruguayans | 12.6 /100 | #208 | Poor 5.2% |
| Alsatians | 11.4 /100 | #209 | Poor 5.2% |
| Immigrants | Uzbekistan | 10.7 /100 | #210 | Poor 5.2% |
| Africans | 10.4 /100 | #211 | Poor 5.2% |
| Immigrants | Honduras | 10.2 /100 | #212 | Poor 5.2% |
| Immigrants | Uruguay | 9.3 /100 | #213 | Tragic 5.2% |
| Albanians | 9.1 /100 | #214 | Tragic 5.2% |
| Immigrants | Fiji | 8.6 /100 | #215 | Tragic 5.2% |
| Cajuns | 8.5 /100 | #216 | Tragic 5.2% |
| Italians | 8.3 /100 | #217 | Tragic 5.2% |
| Spaniards | 7.4 /100 | #218 | Tragic 5.2% |
| Dutch West Indians | 6.9 /100 | #219 | Tragic 5.3% |
| Egyptians | 6.4 /100 | #220 | Tragic 5.3% |
| Arapaho | 6.3 /100 | #221 | Tragic 5.3% |
| Israelis | 6.2 /100 | #222 | Tragic 5.3% |
| Cree | 5.8 /100 | #223 | Tragic 5.3% |
| Immigrants | Syria | 5.6 /100 | #224 | Tragic 5.3% |
| Hondurans | 5.6 /100 | #225 | Tragic 5.3% |
| Immigrants | Croatia | 5.3 /100 | #226 | Tragic 5.3% |