Samoan vs Egyptian Unemployment Among Youth under 25 years
COMPARE
Samoan
Egyptian
Unemployment Among Youth under 25 years
Unemployment Among Youth under 25 years Comparison
Samoans
Egyptians
11.9%
UNEMPLOYMENT AMONG YOUTH UNDER 25 YEARS
7.4/ 100
METRIC RATING
215th/ 347
METRIC RANK
11.7%
UNEMPLOYMENT AMONG YOUTH UNDER 25 YEARS
26.9/ 100
METRIC RATING
196th/ 347
METRIC RANK
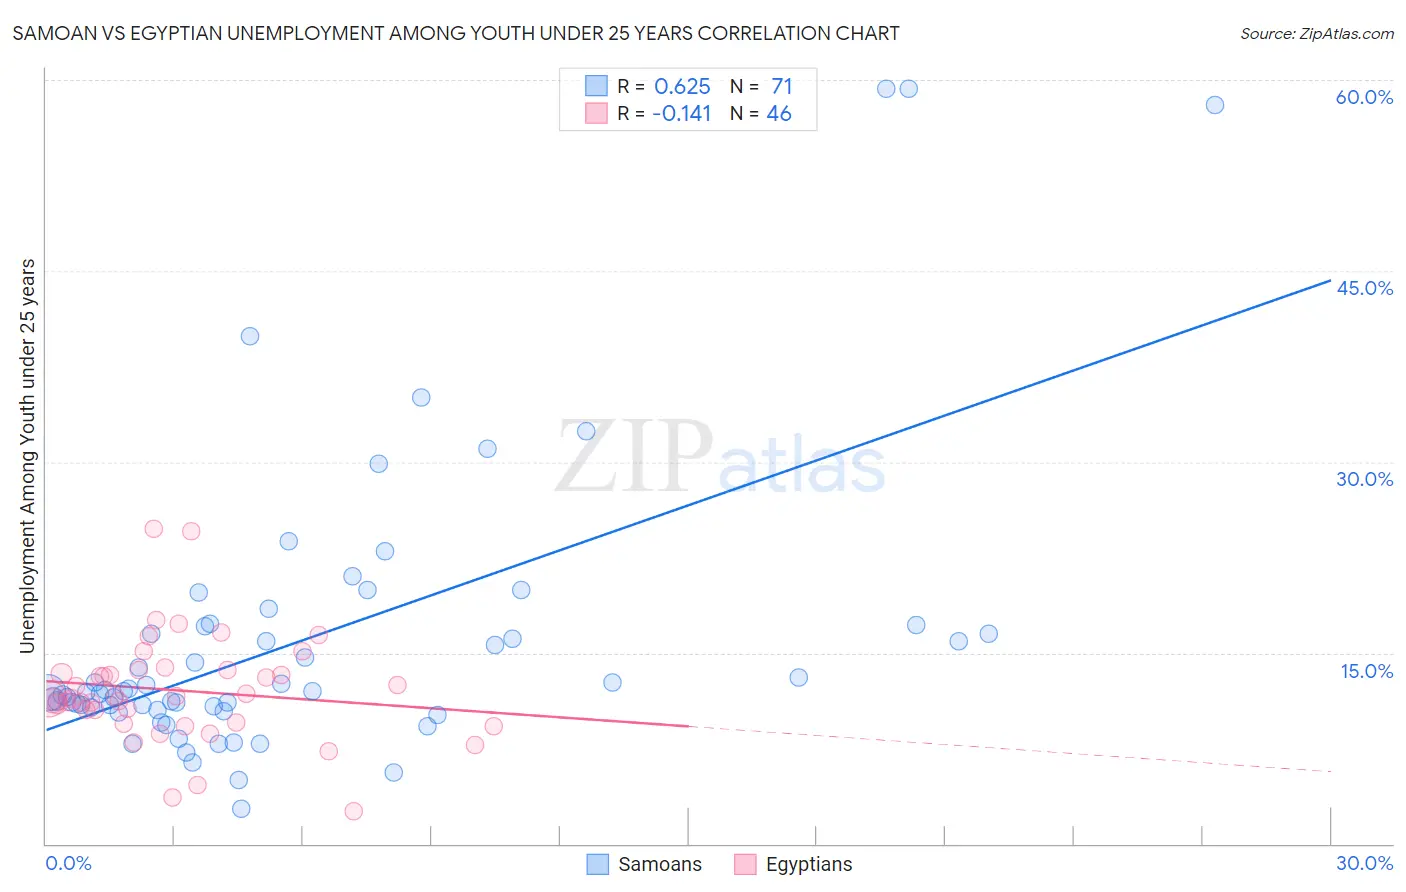
Samoan vs Egyptian Unemployment Among Youth under 25 years Correlation Chart
The statistical analysis conducted on geographies consisting of 223,724,498 people shows a significant positive correlation between the proportion of Samoans and unemployment rate among youth under the age of 25 in the United States with a correlation coefficient (R) of 0.625 and weighted average of 11.9%. Similarly, the statistical analysis conducted on geographies consisting of 275,376,024 people shows a poor negative correlation between the proportion of Egyptians and unemployment rate among youth under the age of 25 in the United States with a correlation coefficient (R) of -0.141 and weighted average of 11.7%, a difference of 1.6%.
Unemployment Among Youth under 25 years Correlation Summary
| Measurement | Samoan | Egyptian |
| Minimum | 2.8% | 2.6% |
| Maximum | 59.3% | 24.7% |
| Range | 56.5% | 22.1% |
| Mean | 15.9% | 12.0% |
| Median | 12.0% | 11.5% |
| Interquartile 25% (IQ1) | 10.7% | 9.6% |
| Interquartile 75% (IQ3) | 17.1% | 13.6% |
| Interquartile Range (IQR) | 6.5% | 4.0% |
| Standard Deviation (Sample) | 11.4% | 4.2% |
| Standard Deviation (Population) | 11.3% | 4.2% |
Demographics Similar to Samoans and Egyptians by Unemployment Among Youth under 25 years
In terms of unemployment among youth under 25 years, the demographic groups most similar to Samoans are Costa Rican (11.9%, a difference of 0.11%), South American (11.9%, a difference of 0.15%), Colombian (11.9%, a difference of 0.23%), Immigrants from Philippines (11.9%, a difference of 0.24%), and Assyrian/Chaldean/Syriac (11.9%, a difference of 0.32%). Similarly, the demographic groups most similar to Egyptians are Paraguayan (11.7%, a difference of 0.010%), Korean (11.7%, a difference of 0.16%), Cherokee (11.8%, a difference of 0.32%), Immigrants from Colombia (11.8%, a difference of 0.33%), and Arab (11.8%, a difference of 0.52%).
| Demographics | Rating | Rank | Unemployment Among Youth under 25 years |
| Paraguayans | 27.2 /100 | #195 | Fair 11.7% |
| Egyptians | 26.9 /100 | #196 | Fair 11.7% |
| Koreans | 23.9 /100 | #197 | Fair 11.7% |
| Cherokee | 21.2 /100 | #198 | Fair 11.8% |
| Immigrants | Colombia | 20.9 /100 | #199 | Fair 11.8% |
| Arabs | 18.0 /100 | #200 | Poor 11.8% |
| Palestinians | 16.0 /100 | #201 | Poor 11.8% |
| Marshallese | 15.8 /100 | #202 | Poor 11.8% |
| Immigrants | Peru | 15.3 /100 | #203 | Poor 11.8% |
| Immigrants | Costa Rica | 15.2 /100 | #204 | Poor 11.8% |
| Peruvians | 14.0 /100 | #205 | Poor 11.8% |
| Immigrants | Pakistan | 12.6 /100 | #206 | Poor 11.8% |
| Immigrants | Southern Europe | 12.3 /100 | #207 | Poor 11.8% |
| Comanche | 12.1 /100 | #208 | Poor 11.8% |
| Immigrants | Lebanon | 11.3 /100 | #209 | Poor 11.8% |
| Assyrians/Chaldeans/Syriacs | 9.8 /100 | #210 | Tragic 11.9% |
| Immigrants | Philippines | 9.2 /100 | #211 | Tragic 11.9% |
| Colombians | 9.1 /100 | #212 | Tragic 11.9% |
| South Americans | 8.5 /100 | #213 | Tragic 11.9% |
| Costa Ricans | 8.2 /100 | #214 | Tragic 11.9% |
| Samoans | 7.4 /100 | #215 | Tragic 11.9% |