Immigrants from Poland vs Immigrants from Scotland Unemployment Among Ages 65 to 74 years
COMPARE
Immigrants from Poland
Immigrants from Scotland
Unemployment Among Ages 65 to 74 years
Unemployment Among Ages 65 to 74 years Comparison
Immigrants from Poland
Immigrants from Scotland
5.3%
UNEMPLOYMENT AMONG AGES 65 TO 74 YEARS
73.2/ 100
METRIC RATING
150th/ 347
METRIC RANK
5.2%
UNEMPLOYMENT AMONG AGES 65 TO 74 YEARS
98.6/ 100
METRIC RATING
81st/ 347
METRIC RANK
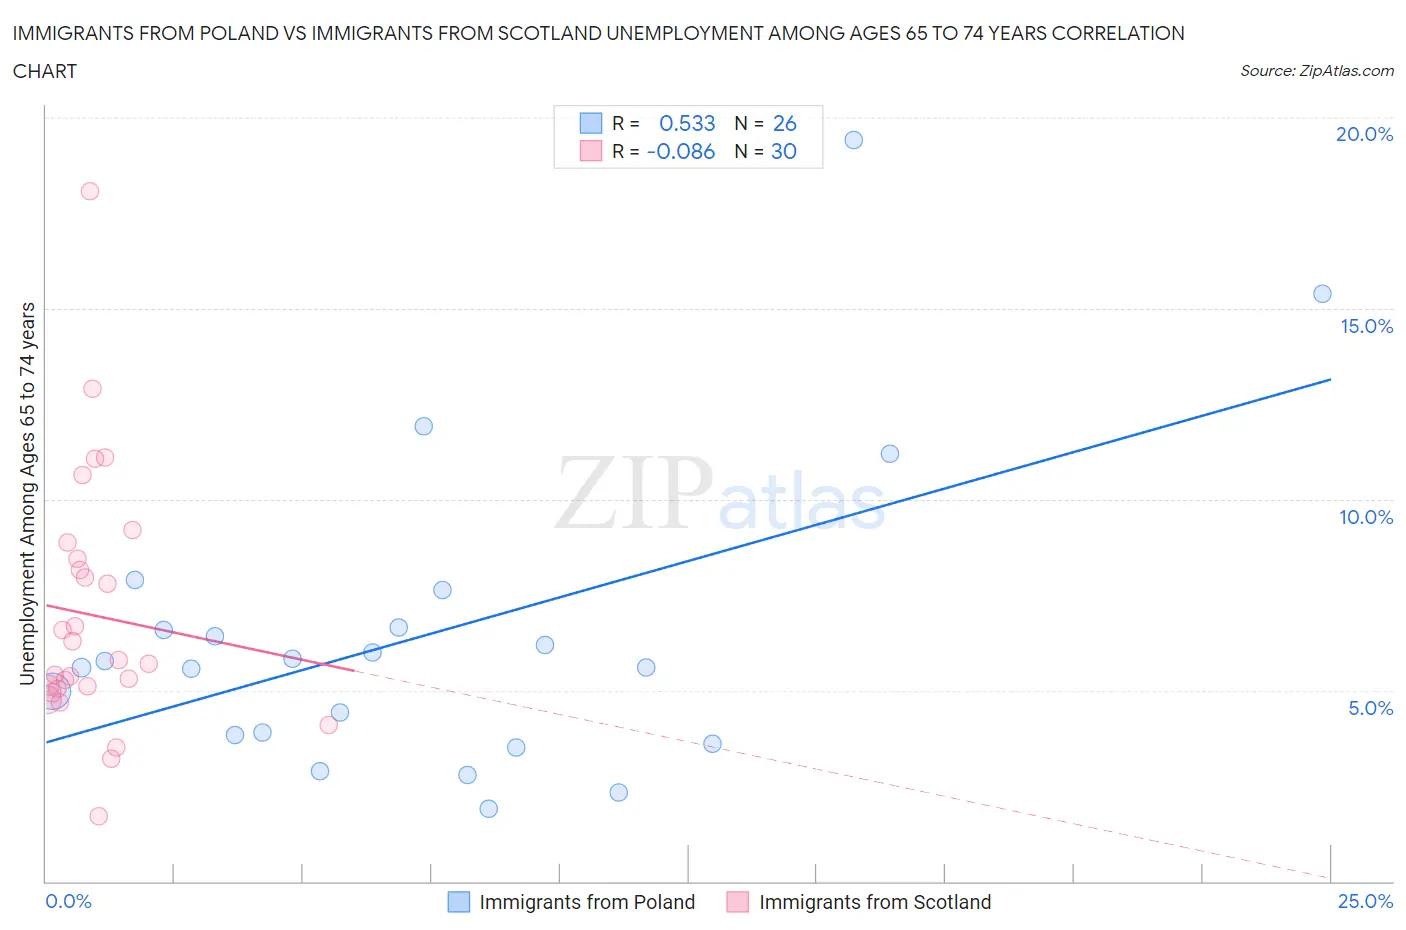
Immigrants from Poland vs Immigrants from Scotland Unemployment Among Ages 65 to 74 years Correlation Chart
The statistical analysis conducted on geographies consisting of 277,447,494 people shows a substantial positive correlation between the proportion of Immigrants from Poland and unemployment rate among population between the ages 65 and 74 in the United States with a correlation coefficient (R) of 0.533 and weighted average of 5.3%. Similarly, the statistical analysis conducted on geographies consisting of 183,030,600 people shows a slight negative correlation between the proportion of Immigrants from Scotland and unemployment rate among population between the ages 65 and 74 in the United States with a correlation coefficient (R) of -0.086 and weighted average of 5.2%, a difference of 2.8%.
Unemployment Among Ages 65 to 74 years Correlation Summary
| Measurement | Immigrants from Poland | Immigrants from Scotland |
| Minimum | 1.9% | 1.7% |
| Maximum | 19.4% | 18.1% |
| Range | 17.5% | 16.4% |
| Mean | 6.5% | 7.0% |
| Median | 5.7% | 5.8% |
| Interquartile 25% (IQ1) | 3.8% | 5.0% |
| Interquartile 75% (IQ3) | 6.7% | 8.5% |
| Interquartile Range (IQR) | 2.8% | 3.4% |
| Standard Deviation (Sample) | 4.0% | 3.3% |
| Standard Deviation (Population) | 4.0% | 3.3% |
Similar Demographics by Unemployment Among Ages 65 to 74 years
Demographics Similar to Immigrants from Poland by Unemployment Among Ages 65 to 74 years
In terms of unemployment among ages 65 to 74 years, the demographic groups most similar to Immigrants from Poland are Immigrants from Romania (5.3%, a difference of 0.010%), Immigrants from Indonesia (5.3%, a difference of 0.010%), Immigrants from Sri Lanka (5.3%, a difference of 0.020%), Spanish (5.3%, a difference of 0.030%), and Immigrants from Cabo Verde (5.3%, a difference of 0.030%).
| Demographics | Rating | Rank | Unemployment Among Ages 65 to 74 years |
| New Zealanders | 76.1 /100 | #143 | Good 5.3% |
| Immigrants | Chile | 76.0 /100 | #144 | Good 5.3% |
| Canadians | 75.0 /100 | #145 | Good 5.3% |
| Irish | 74.8 /100 | #146 | Good 5.3% |
| Immigrants | Latvia | 74.6 /100 | #147 | Good 5.3% |
| Immigrants | Sri Lanka | 73.8 /100 | #148 | Good 5.3% |
| Immigrants | Romania | 73.5 /100 | #149 | Good 5.3% |
| Immigrants | Poland | 73.2 /100 | #150 | Good 5.3% |
| Immigrants | Indonesia | 72.9 /100 | #151 | Good 5.3% |
| Spanish | 72.6 /100 | #152 | Good 5.3% |
| Immigrants | Cabo Verde | 72.5 /100 | #153 | Good 5.3% |
| Poles | 72.4 /100 | #154 | Good 5.3% |
| Immigrants | Cameroon | 72.1 /100 | #155 | Good 5.3% |
| Dutch | 72.0 /100 | #156 | Good 5.3% |
| Immigrants | Eastern Europe | 71.5 /100 | #157 | Good 5.3% |
Demographics Similar to Immigrants from Scotland by Unemployment Among Ages 65 to 74 years
In terms of unemployment among ages 65 to 74 years, the demographic groups most similar to Immigrants from Scotland are Thai (5.2%, a difference of 0.0%), Immigrants from South Africa (5.2%, a difference of 0.010%), Slavic (5.2%, a difference of 0.030%), Immigrants from Middle Africa (5.2%, a difference of 0.15%), and Northern European (5.2%, a difference of 0.22%).
| Demographics | Rating | Rank | Unemployment Among Ages 65 to 74 years |
| Afghans | 99.0 /100 | #74 | Exceptional 5.2% |
| Okinawans | 99.0 /100 | #75 | Exceptional 5.2% |
| Estonians | 99.0 /100 | #76 | Exceptional 5.2% |
| Immigrants | Sudan | 98.9 /100 | #77 | Exceptional 5.2% |
| Northern Europeans | 98.9 /100 | #78 | Exceptional 5.2% |
| Slavs | 98.7 /100 | #79 | Exceptional 5.2% |
| Immigrants | South Africa | 98.6 /100 | #80 | Exceptional 5.2% |
| Immigrants | Scotland | 98.6 /100 | #81 | Exceptional 5.2% |
| Thais | 98.6 /100 | #82 | Exceptional 5.2% |
| Immigrants | Middle Africa | 98.4 /100 | #83 | Exceptional 5.2% |
| Immigrants | Hungary | 98.0 /100 | #84 | Exceptional 5.2% |
| British | 97.9 /100 | #85 | Exceptional 5.2% |
| Danes | 97.9 /100 | #86 | Exceptional 5.2% |
| Scottish | 97.9 /100 | #87 | Exceptional 5.2% |
| Immigrants | Saudi Arabia | 97.9 /100 | #88 | Exceptional 5.2% |