Immigrants from Poland vs Immigrants from Scotland Unemployment Among Ages 16 to 19 years
COMPARE
Immigrants from Poland
Immigrants from Scotland
Unemployment Among Ages 16 to 19 years
Unemployment Among Ages 16 to 19 years Comparison
Immigrants from Poland
Immigrants from Scotland
17.0%
UNEMPLOYMENT AMONG AGES 16 TO 19 YEARS
93.1/ 100
METRIC RATING
114th/ 347
METRIC RANK
16.8%
UNEMPLOYMENT AMONG AGES 16 TO 19 YEARS
97.2/ 100
METRIC RATING
86th/ 347
METRIC RANK
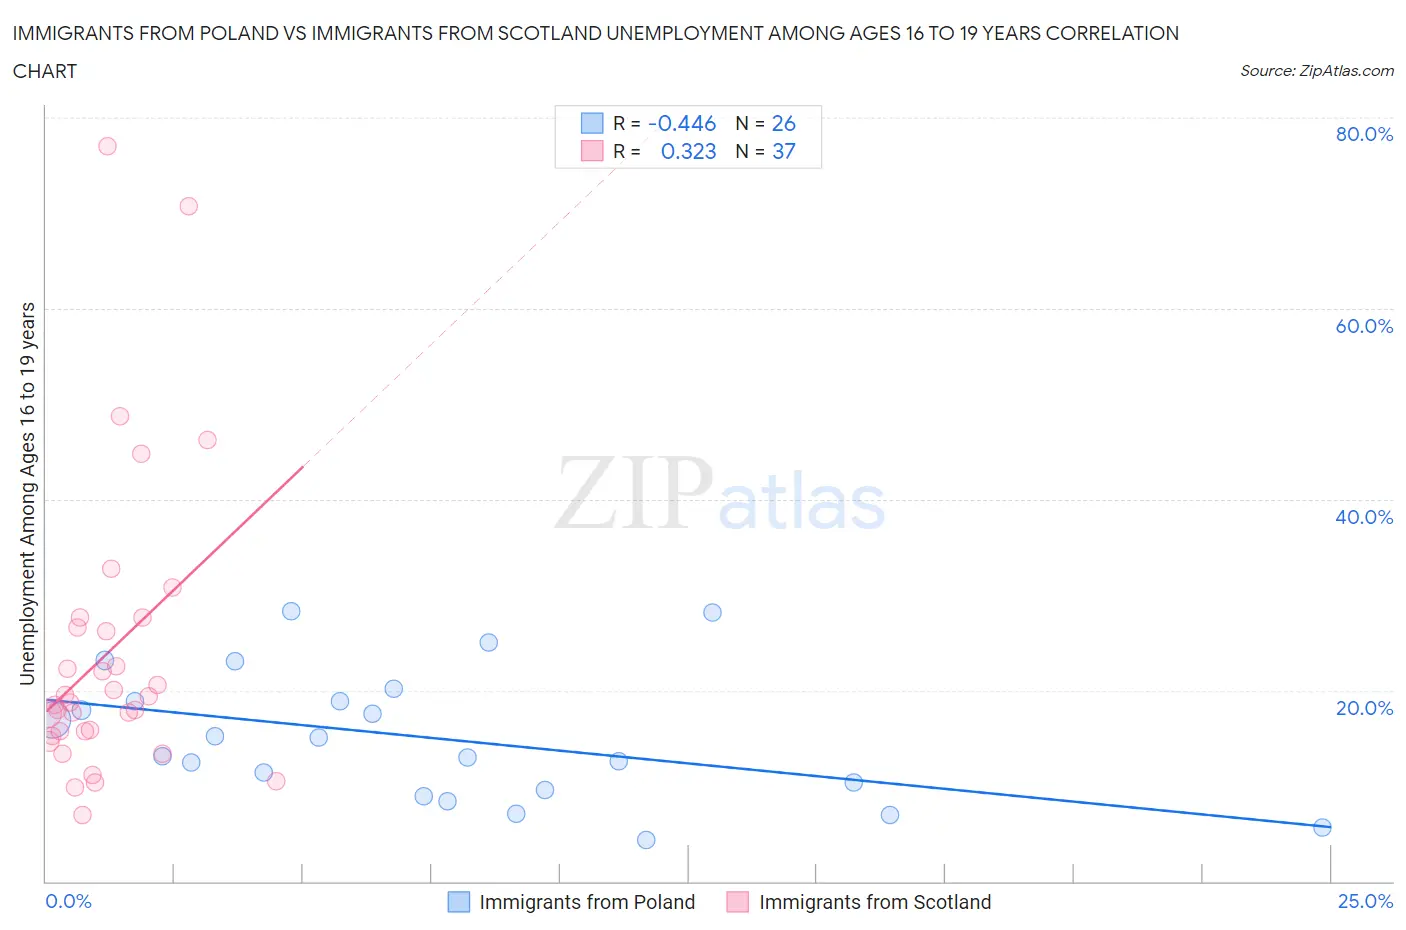
Immigrants from Poland vs Immigrants from Scotland Unemployment Among Ages 16 to 19 years Correlation Chart
The statistical analysis conducted on geographies consisting of 290,013,862 people shows a moderate negative correlation between the proportion of Immigrants from Poland and unemployment rate among population between the ages 16 and 19 in the United States with a correlation coefficient (R) of -0.446 and weighted average of 17.0%. Similarly, the statistical analysis conducted on geographies consisting of 189,708,027 people shows a mild positive correlation between the proportion of Immigrants from Scotland and unemployment rate among population between the ages 16 and 19 in the United States with a correlation coefficient (R) of 0.323 and weighted average of 16.8%, a difference of 1.2%.
Unemployment Among Ages 16 to 19 years Correlation Summary
| Measurement | Immigrants from Poland | Immigrants from Scotland |
| Minimum | 4.3% | 7.0% |
| Maximum | 28.3% | 77.0% |
| Range | 24.0% | 70.0% |
| Mean | 15.1% | 23.9% |
| Median | 14.1% | 18.7% |
| Interquartile 25% (IQ1) | 9.5% | 15.5% |
| Interquartile 75% (IQ3) | 18.9% | 27.1% |
| Interquartile Range (IQR) | 9.4% | 11.6% |
| Standard Deviation (Sample) | 6.8% | 15.5% |
| Standard Deviation (Population) | 6.7% | 15.3% |
Similar Demographics by Unemployment Among Ages 16 to 19 years
Demographics Similar to Immigrants from Poland by Unemployment Among Ages 16 to 19 years
In terms of unemployment among ages 16 to 19 years, the demographic groups most similar to Immigrants from Poland are Icelander (17.0%, a difference of 0.070%), Immigrants from Iraq (17.0%, a difference of 0.13%), Brazilian (17.1%, a difference of 0.14%), Immigrants from Asia (17.0%, a difference of 0.16%), and Immigrants from Korea (17.1%, a difference of 0.16%).
| Demographics | Rating | Rank | Unemployment Among Ages 16 to 19 years |
| Immigrants | Brazil | 94.2 /100 | #107 | Exceptional 17.0% |
| Malaysians | 94.2 /100 | #108 | Exceptional 17.0% |
| Iranians | 94.1 /100 | #109 | Exceptional 17.0% |
| Immigrants | Netherlands | 93.9 /100 | #110 | Exceptional 17.0% |
| Immigrants | Asia | 93.9 /100 | #111 | Exceptional 17.0% |
| Immigrants | Iraq | 93.7 /100 | #112 | Exceptional 17.0% |
| Icelanders | 93.4 /100 | #113 | Exceptional 17.0% |
| Immigrants | Poland | 93.1 /100 | #114 | Exceptional 17.0% |
| Brazilians | 92.3 /100 | #115 | Exceptional 17.1% |
| Immigrants | Korea | 92.2 /100 | #116 | Exceptional 17.1% |
| Immigrants | Sri Lanka | 92.0 /100 | #117 | Exceptional 17.1% |
| Venezuelans | 91.8 /100 | #118 | Exceptional 17.1% |
| Hungarians | 91.6 /100 | #119 | Exceptional 17.1% |
| Immigrants | Middle Africa | 90.9 /100 | #120 | Exceptional 17.1% |
| Immigrants | Moldova | 90.7 /100 | #121 | Exceptional 17.1% |
Demographics Similar to Immigrants from Scotland by Unemployment Among Ages 16 to 19 years
In terms of unemployment among ages 16 to 19 years, the demographic groups most similar to Immigrants from Scotland are Immigrants from Kuwait (16.8%, a difference of 0.010%), Greek (16.9%, a difference of 0.070%), French (16.8%, a difference of 0.080%), Ugandan (16.8%, a difference of 0.12%), and Immigrants from South Africa (16.9%, a difference of 0.12%).
| Demographics | Rating | Rank | Unemployment Among Ages 16 to 19 years |
| Slovaks | 97.5 /100 | #79 | Exceptional 16.8% |
| French Canadians | 97.5 /100 | #80 | Exceptional 16.8% |
| Immigrants | Latvia | 97.5 /100 | #81 | Exceptional 16.8% |
| Whites/Caucasians | 97.5 /100 | #82 | Exceptional 16.8% |
| Ugandans | 97.4 /100 | #83 | Exceptional 16.8% |
| French | 97.4 /100 | #84 | Exceptional 16.8% |
| Immigrants | Kuwait | 97.2 /100 | #85 | Exceptional 16.8% |
| Immigrants | Scotland | 97.2 /100 | #86 | Exceptional 16.8% |
| Greeks | 97.0 /100 | #87 | Exceptional 16.9% |
| Immigrants | South Africa | 96.9 /100 | #88 | Exceptional 16.9% |
| Canadians | 96.7 /100 | #89 | Exceptional 16.9% |
| Asians | 96.6 /100 | #90 | Exceptional 16.9% |
| Cambodians | 96.3 /100 | #91 | Exceptional 16.9% |
| South Africans | 95.9 /100 | #92 | Exceptional 16.9% |
| Cubans | 95.8 /100 | #93 | Exceptional 16.9% |