Immigrants from Poland vs Chickasaw Unemployment Among Ages 65 to 74 years

COMPARE

Immigrants from Poland
Race
Ancestry
AfghanAfricanAlaska NativeAlaskan AthabascanAlbanianAleutAlsatianAmericanApacheArabArapahoArgentineanArmenianAssyrian/Chaldean/SyriacAustralianAustrianBahamianBangladeshiBarbadianBasqueBelgianBelizeanBermudanBhutaneseBlackfeetBolivianBrazilianBritishBritish West IndianBulgarianBurmeseCajunCambodianCanadianCape VerdeanCarpatho RusynCelticCentral AmericanCentral American IndianCherokeeCheyenneChileanChineseChippewaChoctawColombianColvilleComancheCosta RicanCreeCreekCroatianCrowCubanCypriotCzechCzechoslovakianDanishDelawareDominicanDutchDutch West IndianEastern EuropeanEcuadorianEgyptianEnglishEstonianEthiopianEuropeanFijianFilipinoFinnishFrenchFrench American IndianFrench CanadianGermanGerman RussianGhanaianGreekGuamanian/ChamorroGuatemalanGuyaneseHaitianHmongHonduranHopiHoumaHungarianIcelanderIndian (Asian)IndonesianInupiatIranianIraqiIrishIroquoisIsraeliItalianJamaicanJapaneseJordanianKenyanKiowaKoreanLaotianLatvianLebaneseLiberianLithuanianLumbeeLuxembourgerMacedonianMalaysianMalteseMarshalleseMenomineeMexicanMexican American IndianMongolianMoroccanNative HawaiianNavajoNepaleseNew ZealanderNicaraguanNigerianNorthern EuropeanNorwegianOkinawanOsageOttawaPaiutePakistaniPalestinianPanamanianParaguayanPennsylvania GermanPeruvianPimaPolishPortuguesePotawatomiPuebloPuerto RicanPuget Sound SalishRomanianRussianSalvadoranSamoanScandinavianScotch-IrishScottishSeminoleSenegaleseSerbianShoshoneSierra LeoneanSiouxSlavicSlovakSloveneSomaliSouth AfricanSouth AmericanSouth American IndianSoviet UnionSpaniardSpanishSpanish AmericanSpanish American IndianSri LankanSubsaharan AfricanSudaneseSwedishSwissSyrianTaiwaneseThaiTlingit-HaidaTohono O'OdhamTonganTrinidadian and TobagonianTsimshianTurkishU.S. Virgin IslanderUgandanUkrainianUruguayanUteVenezuelanVietnameseWelshWest IndianYakamaYaquiYugoslavianYumanYup'ikZimbabwean
Immigration
NonimmigrantsImmigrantsAfghanistanAfricaAlbaniaArgentinaArmeniaAsiaAustraliaAustriaBahamasBangladeshBarbadosBelarusBelgiumBelizeBoliviaBosnia and HerzegovinaBrazilBulgariaBurma/MyanmarCabo VerdeCambodiaCameroonCanadaCaribbeanCentral AmericaChileChinaColombiaCongoCosta RicaCroatiaCubaCzechoslovakiaDenmarkDominicaDominican RepublicEastern AfricaEastern AsiaEastern EuropeEcuadorEgyptEl SalvadorEnglandEritreaEthiopiaEuropeFijiFranceGermanyGhanaGreeceGrenadaGuatemalaGuyanaHaitiHondurasHong KongHungaryIndiaIndonesiaIranIraqIrelandIsraelItalyJamaicaJapanJordanKazakhstanKenyaKoreaKuwaitLaosLatin AmericaLatviaLebanonLiberiaLithuaniaMalaysiaMexicoMicronesiaMiddle AfricaMoldovaMoroccoNepalNetherlandsNicaraguaNigeriaNorth AmericaNorth MacedoniaNorthern AfricaNorthern EuropeNorwayOceaniaPakistanPanamaPeruPhilippinesPolandPortugalRomaniaRussiaSaudi ArabiaScotlandSenegalSerbiaSierra LeoneSingaporeSomaliaSouth AfricaSouth AmericaSouth Central AsiaSouth Eastern AsiaSouthern EuropeSpainSri LankaSt. Vincent and the GrenadinesSudanSwedenSwitzerlandSyriaTaiwanThailandTrinidad and TobagoTurkeyUgandaUkraineUruguayUzbekistanVenezuelaVietnamWest IndiesWestern AfricaWestern AsiaWestern EuropeYemenZaireZimbabweAzores
Chickasaw
Race
Ancestry
AfghanAfricanAlaska NativeAlaskan AthabascanAlbanianAleutAlsatianAmericanApacheArabArapahoArgentineanArmenianAssyrian/Chaldean/SyriacAustralianAustrianBahamianBangladeshiBarbadianBasqueBelgianBelizeanBermudanBhutaneseBlackfeetBolivianBrazilianBritishBritish West IndianBulgarianBurmeseCajunCambodianCanadianCape VerdeanCarpatho RusynCelticCentral AmericanCentral American IndianCherokeeCheyenneChickasawChileanChineseChippewaChoctawColombianColvilleComancheCosta RicanCreeCreekCroatianCrowCubanCypriotCzechCzechoslovakianDanishDelawareDominicanDutchDutch West IndianEastern EuropeanEcuadorianEgyptianEnglishEstonianEthiopianEuropeanFijianFilipinoFinnishFrenchFrench American IndianFrench CanadianGermanGerman RussianGhanaianGreekGuamanian/ChamorroGuatemalanGuyaneseHaitianHmongHonduranHopiHoumaHungarianIcelanderIndian (Asian)IndonesianInupiatIranianIraqiIrishIroquoisIsraeliItalianJamaicanJapaneseJordanianKenyanKiowaKoreanLaotianLatvianLebaneseLiberianLithuanianLumbeeLuxembourgerMacedonianMalaysianMalteseMarshalleseMenomineeMexicanMexican American IndianMongolianMoroccanNative HawaiianNavajoNepaleseNew ZealanderNicaraguanNigerianNorthern EuropeanNorwegianOkinawanOsageOttawaPaiutePakistaniPalestinianPanamanianParaguayanPennsylvania GermanPeruvianPimaPolishPortuguesePotawatomiPuebloPuerto RicanPuget Sound SalishRomanianRussianSalvadoranSamoanScandinavianScotch-IrishScottishSeminoleSenegaleseSerbianShoshoneSierra LeoneanSiouxSlavicSlovakSloveneSomaliSouth AfricanSouth AmericanSouth American IndianSoviet UnionSpaniardSpanishSpanish AmericanSpanish American IndianSri LankanSubsaharan AfricanSudaneseSwedishSwissSyrianTaiwaneseThaiTlingit-HaidaTohono O'OdhamTonganTrinidadian and TobagonianTsimshianTurkishU.S. Virgin IslanderUgandanUkrainianUruguayanUteVenezuelanVietnameseWelshWest IndianYakamaYaquiYugoslavianYumanYup'ikZimbabwean
Immigration
NonimmigrantsImmigrantsAfghanistanAfricaAlbaniaArgentinaArmeniaAsiaAustraliaAustriaBahamasBangladeshBarbadosBelarusBelgiumBelizeBoliviaBosnia and HerzegovinaBrazilBulgariaBurma/MyanmarCabo VerdeCambodiaCameroonCanadaCaribbeanCentral AmericaChileChinaColombiaCongoCosta RicaCroatiaCubaCzechoslovakiaDenmarkDominicaDominican RepublicEastern AfricaEastern AsiaEastern EuropeEcuadorEgyptEl SalvadorEnglandEritreaEthiopiaEuropeFijiFranceGermanyGhanaGreeceGrenadaGuatemalaGuyanaHaitiHondurasHong KongHungaryIndiaIndonesiaIranIraqIrelandIsraelItalyJamaicaJapanJordanKazakhstanKenyaKoreaKuwaitLaosLatin AmericaLatviaLebanonLiberiaLithuaniaMalaysiaMexicoMicronesiaMiddle AfricaMoldovaMoroccoNepalNetherlandsNicaraguaNigeriaNorth AmericaNorth MacedoniaNorthern AfricaNorthern EuropeNorwayOceaniaPakistanPanamaPeruPhilippinesPortugalRomaniaRussiaSaudi ArabiaScotlandSenegalSerbiaSierra LeoneSingaporeSomaliaSouth AfricaSouth AmericaSouth Central AsiaSouth Eastern AsiaSouthern EuropeSpainSri LankaSt. Vincent and the GrenadinesSudanSwedenSwitzerlandSyriaTaiwanThailandTrinidad and TobagoTurkeyUgandaUkraineUruguayUzbekistanVenezuelaVietnamWest IndiesWestern AfricaWestern AsiaWestern EuropeYemenZaireZimbabweAzores
Unemployment Among Ages 65 to 74 years
Income
Poverty
Unemployment
Labor Participation
Family Structure
Vehicle Availability
Education Level
Disability

Unemployment Among Ages 65 to 74 years Comparison

Immigrants from Poland

Chickasaw

Good
Exceptional
5.3%
UNEMPLOYMENT AMONG AGES 65 TO 74 YEARS
73.2/ 100
METRIC RATING
150th/ 347
METRIC RANK
4.7%
UNEMPLOYMENT AMONG AGES 65 TO 74 YEARS
100.0/ 100
METRIC RATING
9th/ 347
METRIC RANK

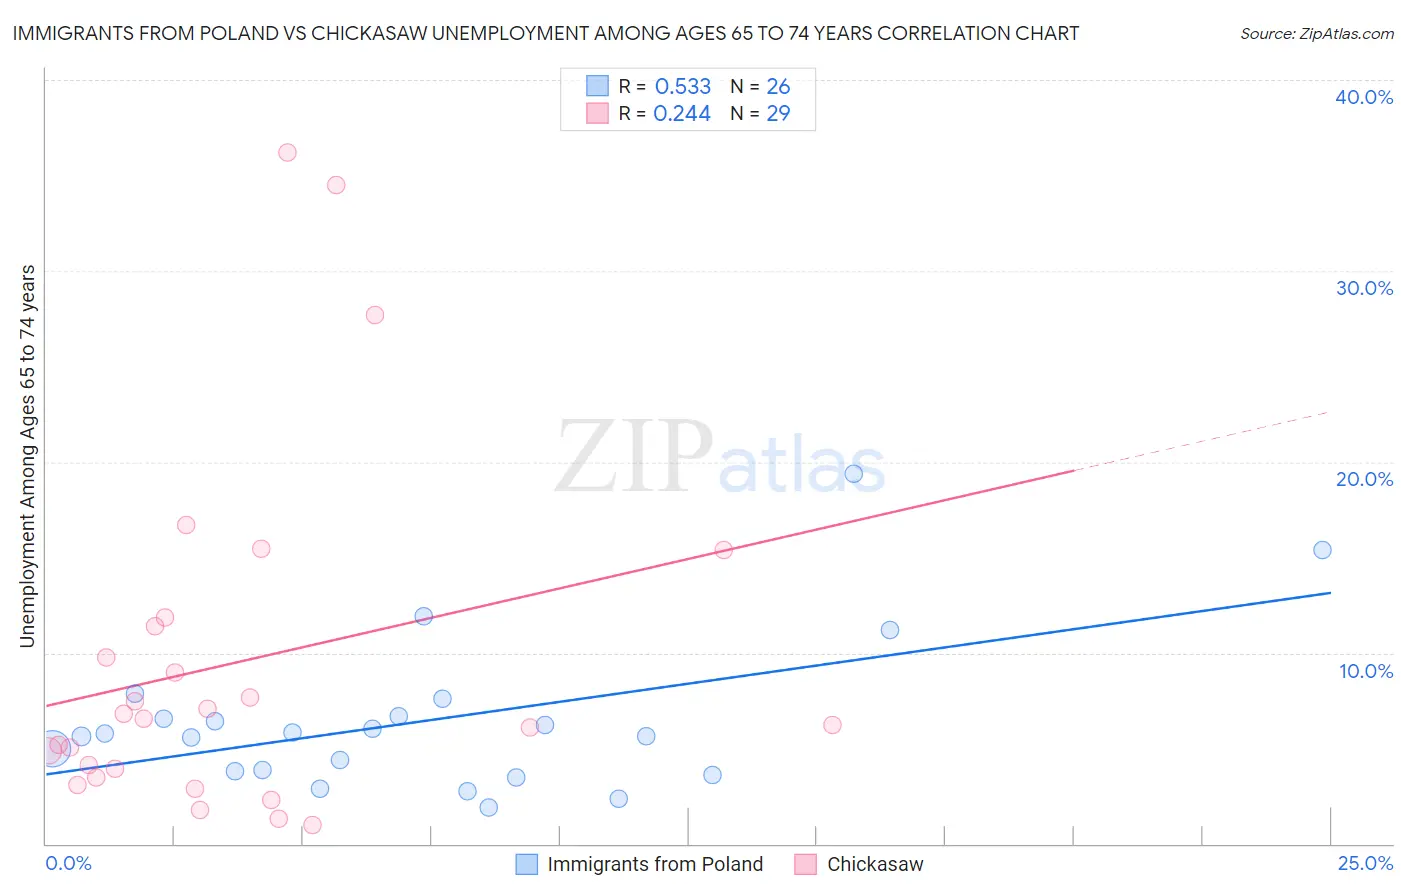
Immigrants from Poland vs Chickasaw Unemployment Among Ages 65 to 74 years Correlation Chart

The statistical analysis conducted on geographies consisting of 277,447,494 people shows a substantial positive correlation between the proportion of Immigrants from Poland and unemployment rate among population between the ages 65 and 74 in the United States with a correlation coefficient (R) of 0.533 and weighted average of 5.3%. Similarly, the statistical analysis conducted on geographies consisting of 136,812,598 people shows a weak positive correlation between the proportion of Chickasaw and unemployment rate among population between the ages 65 and 74 in the United States with a correlation coefficient (R) of 0.244 and weighted average of 4.7%, a difference of 12.9%.
Immigrants from Poland vs Chickasaw Unemployment Among Ages 65 to 74 years

Unemployment Among Ages 65 to 74 years Correlation Summary

MeasurementImmigrants from PolandChickasaw
Minimum1.9%0.98%
Maximum19.4%36.2%
Range17.5%35.2%
Mean6.5%9.5%
Median5.7%6.6%
Interquartile 25% (IQ1)3.8%3.7%
Interquartile 75% (IQ3)6.7%11.6%
Interquartile Range (IQR)2.8%7.9%
Standard Deviation (Sample)4.0%9.1%
Standard Deviation (Population)4.0%9.0%

Similar Demographics by Unemployment Among Ages 65 to 74 years

Demographics Similar to Immigrants from Poland by Unemployment Among Ages 65 to 74 years

In terms of unemployment among ages 65 to 74 years, the demographic groups most similar to Immigrants from Poland are Immigrants from Romania (5.3%, a difference of 0.010%), Immigrants from Indonesia (5.3%, a difference of 0.010%), Immigrants from Sri Lanka (5.3%, a difference of 0.020%), Spanish (5.3%, a difference of 0.030%), and Immigrants from Cabo Verde (5.3%, a difference of 0.030%).
DemographicsRating | RankUnemployment Among Ages 65 to 74 years
New Zealanders
76.1
/100
|
#143
Good
5.3%
Immigrants | Chile
76.0
/100
|
#144
Good
5.3%
Canadians
75.0
/100
|
#145
Good
5.3%
Irish
74.8
/100
|
#146
Good
5.3%
Immigrants | Latvia
74.6
/100
|
#147
Good
5.3%
Immigrants | Sri Lanka
73.8
/100
|
#148
Good
5.3%
Immigrants | Romania
73.5
/100
|
#149
Good
5.3%
Immigrants | Poland
73.2
/100
|
#150
Good
5.3%
Immigrants | Indonesia
72.9
/100
|
#151
Good
5.3%
Spanish
72.6
/100
|
#152
Good
5.3%
Immigrants | Cabo Verde
72.5
/100
|
#153
Good
5.3%
Poles
72.4
/100
|
#154
Good
5.3%
Immigrants | Cameroon
72.1
/100
|
#155
Good
5.3%
Dutch
72.0
/100
|
#156
Good
5.3%
Immigrants | Eastern Europe
71.5
/100
|
#157
Good
5.3%

Demographics Similar to Chickasaw by Unemployment Among Ages 65 to 74 years

In terms of unemployment among ages 65 to 74 years, the demographic groups most similar to Chickasaw are Osage (4.7%, a difference of 0.11%), Comanche (4.7%, a difference of 0.26%), Indonesian (4.7%, a difference of 0.43%), Immigrants from Congo (4.7%, a difference of 0.52%), and Tongan (4.7%, a difference of 0.68%).
DemographicsRating | RankUnemployment Among Ages 65 to 74 years
Chinese
100.0
/100
|
#2
Exceptional
4.4%
Fijians
100.0
/100
|
#3
Exceptional
4.5%
Tsimshian
100.0
/100
|
#4
Exceptional
4.6%
Sudanese
100.0
/100
|
#5
Exceptional
4.6%
Immigrants | Cuba
100.0
/100
|
#6
Exceptional
4.6%
Indonesians
100.0
/100
|
#7
Exceptional
4.7%
Comanche
100.0
/100
|
#8
Exceptional
4.7%
Chickasaw
100.0
/100
|
#9
Exceptional
4.7%
Osage
100.0
/100
|
#10
Exceptional
4.7%
Immigrants | Congo
100.0
/100
|
#11
Exceptional
4.7%
Tongans
100.0
/100
|
#12
Exceptional
4.7%
Lumbee
100.0
/100
|
#13
Exceptional
4.8%
Cubans
100.0
/100
|
#14
Exceptional
4.8%
Immigrants | North Macedonia
100.0
/100
|
#15
Exceptional
4.8%
Immigrants | Burma/Myanmar
100.0
/100
|
#16
Exceptional
4.8%