Honduran vs Immigrants from Scotland Unemployment Among Ages 16 to 19 years
COMPARE
Honduran
Immigrants from Scotland
Unemployment Among Ages 16 to 19 years
Unemployment Among Ages 16 to 19 years Comparison
Hondurans
Immigrants from Scotland
19.2%
UNEMPLOYMENT AMONG AGES 16 TO 19 YEARS
0.1/ 100
METRIC RATING
270th/ 347
METRIC RANK
16.8%
UNEMPLOYMENT AMONG AGES 16 TO 19 YEARS
97.2/ 100
METRIC RATING
86th/ 347
METRIC RANK
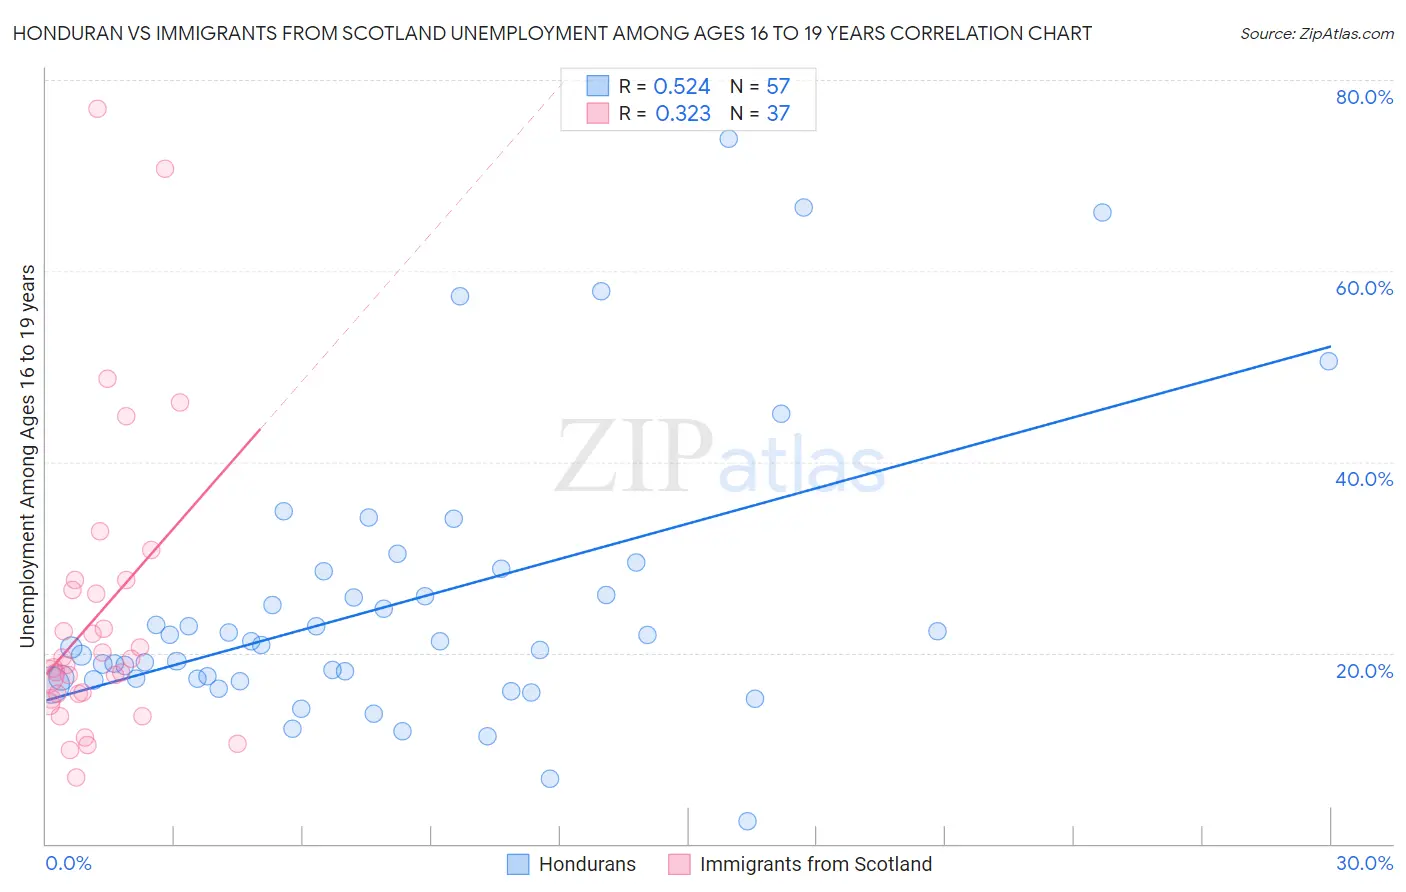
Honduran vs Immigrants from Scotland Unemployment Among Ages 16 to 19 years Correlation Chart
The statistical analysis conducted on geographies consisting of 343,682,846 people shows a substantial positive correlation between the proportion of Hondurans and unemployment rate among population between the ages 16 and 19 in the United States with a correlation coefficient (R) of 0.524 and weighted average of 19.2%. Similarly, the statistical analysis conducted on geographies consisting of 189,708,027 people shows a mild positive correlation between the proportion of Immigrants from Scotland and unemployment rate among population between the ages 16 and 19 in the United States with a correlation coefficient (R) of 0.323 and weighted average of 16.8%, a difference of 13.7%.
Unemployment Among Ages 16 to 19 years Correlation Summary
| Measurement | Honduran | Immigrants from Scotland |
| Minimum | 2.3% | 7.0% |
| Maximum | 73.9% | 77.0% |
| Range | 71.6% | 70.0% |
| Mean | 25.1% | 23.9% |
| Median | 20.8% | 18.7% |
| Interquartile 25% (IQ1) | 17.2% | 15.5% |
| Interquartile 75% (IQ3) | 27.3% | 27.1% |
| Interquartile Range (IQR) | 10.1% | 11.6% |
| Standard Deviation (Sample) | 14.8% | 15.5% |
| Standard Deviation (Population) | 14.6% | 15.3% |
Similar Demographics by Unemployment Among Ages 16 to 19 years
Demographics Similar to Hondurans by Unemployment Among Ages 16 to 19 years
In terms of unemployment among ages 16 to 19 years, the demographic groups most similar to Hondurans are Lumbee (19.1%, a difference of 0.18%), Immigrants from El Salvador (19.1%, a difference of 0.26%), Blackfeet (19.2%, a difference of 0.38%), Hispanic or Latino (19.2%, a difference of 0.50%), and Israeli (19.0%, a difference of 0.54%).
| Demographics | Rating | Rank | Unemployment Among Ages 16 to 19 years |
| Cree | 0.1 /100 | #263 | Tragic 19.0% |
| Yaqui | 0.1 /100 | #264 | Tragic 19.0% |
| Choctaw | 0.1 /100 | #265 | Tragic 19.0% |
| Immigrants | Honduras | 0.1 /100 | #266 | Tragic 19.0% |
| Israelis | 0.1 /100 | #267 | Tragic 19.0% |
| Immigrants | El Salvador | 0.1 /100 | #268 | Tragic 19.1% |
| Lumbee | 0.1 /100 | #269 | Tragic 19.1% |
| Hondurans | 0.1 /100 | #270 | Tragic 19.2% |
| Blackfeet | 0.0 /100 | #271 | Tragic 19.2% |
| Hispanics or Latinos | 0.0 /100 | #272 | Tragic 19.2% |
| Immigrants | Panama | 0.0 /100 | #273 | Tragic 19.3% |
| Shoshone | 0.0 /100 | #274 | Tragic 19.3% |
| Paraguayans | 0.0 /100 | #275 | Tragic 19.4% |
| Immigrants | Latin America | 0.0 /100 | #276 | Tragic 19.4% |
| Immigrants | Western Africa | 0.0 /100 | #277 | Tragic 19.4% |
Demographics Similar to Immigrants from Scotland by Unemployment Among Ages 16 to 19 years
In terms of unemployment among ages 16 to 19 years, the demographic groups most similar to Immigrants from Scotland are Immigrants from Kuwait (16.8%, a difference of 0.010%), Greek (16.9%, a difference of 0.070%), French (16.8%, a difference of 0.080%), Ugandan (16.8%, a difference of 0.12%), and Immigrants from South Africa (16.9%, a difference of 0.12%).
| Demographics | Rating | Rank | Unemployment Among Ages 16 to 19 years |
| Slovaks | 97.5 /100 | #79 | Exceptional 16.8% |
| French Canadians | 97.5 /100 | #80 | Exceptional 16.8% |
| Immigrants | Latvia | 97.5 /100 | #81 | Exceptional 16.8% |
| Whites/Caucasians | 97.5 /100 | #82 | Exceptional 16.8% |
| Ugandans | 97.4 /100 | #83 | Exceptional 16.8% |
| French | 97.4 /100 | #84 | Exceptional 16.8% |
| Immigrants | Kuwait | 97.2 /100 | #85 | Exceptional 16.8% |
| Immigrants | Scotland | 97.2 /100 | #86 | Exceptional 16.8% |
| Greeks | 97.0 /100 | #87 | Exceptional 16.9% |
| Immigrants | South Africa | 96.9 /100 | #88 | Exceptional 16.9% |
| Canadians | 96.7 /100 | #89 | Exceptional 16.9% |
| Asians | 96.6 /100 | #90 | Exceptional 16.9% |
| Cambodians | 96.3 /100 | #91 | Exceptional 16.9% |
| South Africans | 95.9 /100 | #92 | Exceptional 16.9% |
| Cubans | 95.8 /100 | #93 | Exceptional 16.9% |