Austrian vs Australian Unemployment Among Ages 25 to 29 years
COMPARE
Austrian
Australian
Unemployment Among Ages 25 to 29 years
Unemployment Among Ages 25 to 29 years Comparison
Austrians
Australians
6.5%
UNEMPLOYMENT AMONG AGES 25 TO 29 YEARS
73.8/ 100
METRIC RATING
139th/ 347
METRIC RANK
6.4%
UNEMPLOYMENT AMONG AGES 25 TO 29 YEARS
93.6/ 100
METRIC RATING
93rd/ 347
METRIC RANK
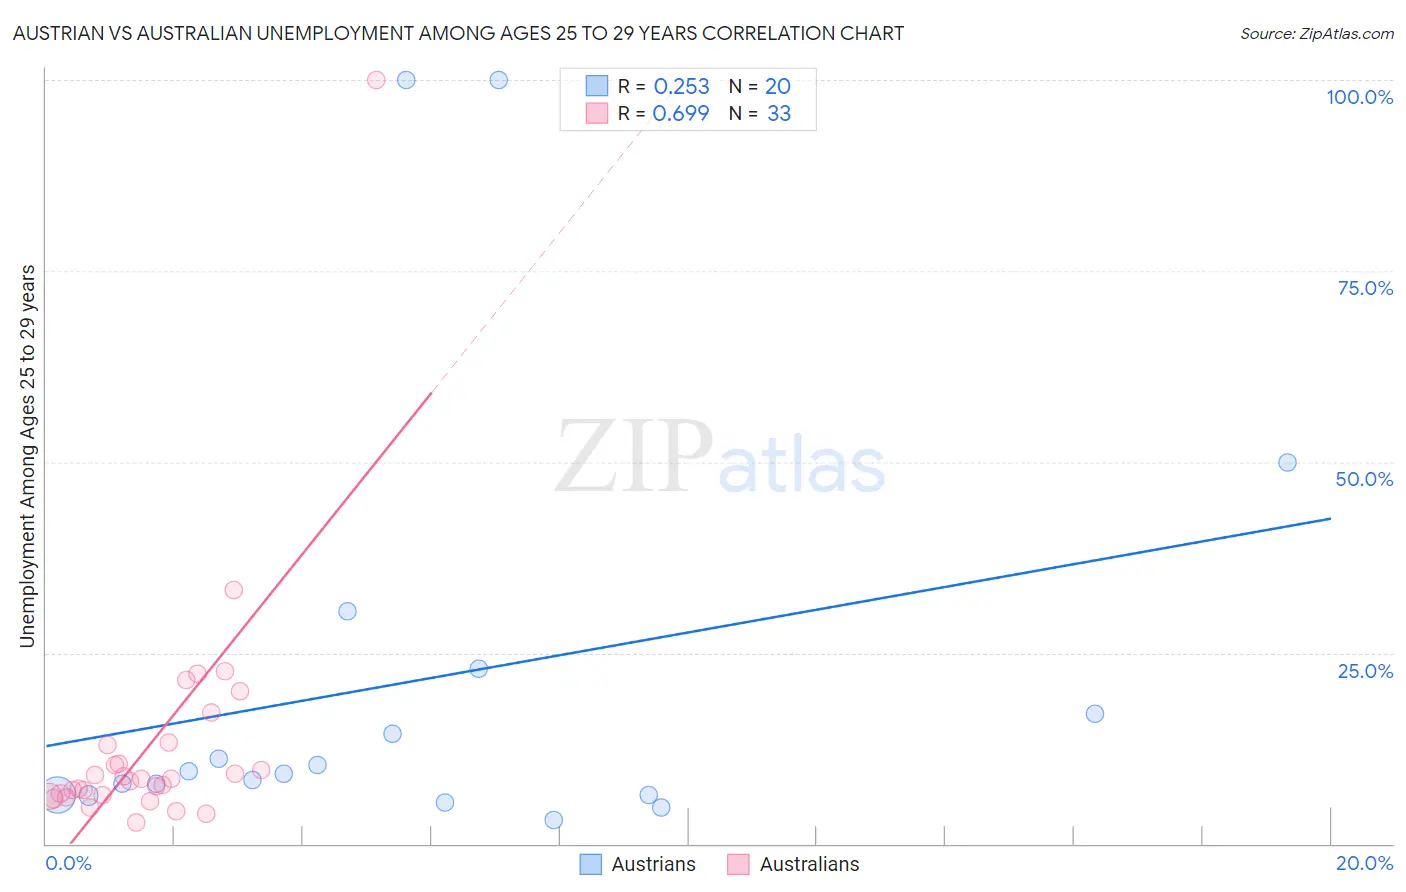
Austrian vs Australian Unemployment Among Ages 25 to 29 years Correlation Chart
The statistical analysis conducted on geographies consisting of 419,803,444 people shows a weak positive correlation between the proportion of Austrians and unemployment rate among population between the ages 25 and 29 in the United States with a correlation coefficient (R) of 0.253 and weighted average of 6.5%. Similarly, the statistical analysis conducted on geographies consisting of 216,520,214 people shows a significant positive correlation between the proportion of Australians and unemployment rate among population between the ages 25 and 29 in the United States with a correlation coefficient (R) of 0.699 and weighted average of 6.4%, a difference of 2.7%.
Unemployment Among Ages 25 to 29 years Correlation Summary
| Measurement | Austrian | Australian |
| Minimum | 3.1% | 2.8% |
| Maximum | 100.0% | 100.0% |
| Range | 96.9% | 97.2% |
| Mean | 21.6% | 13.2% |
| Median | 9.4% | 8.4% |
| Interquartile 25% (IQ1) | 6.4% | 6.3% |
| Interquartile 75% (IQ3) | 20.0% | 13.1% |
| Interquartile Range (IQR) | 13.6% | 6.8% |
| Standard Deviation (Sample) | 29.0% | 17.0% |
| Standard Deviation (Population) | 28.2% | 16.7% |
Similar Demographics by Unemployment Among Ages 25 to 29 years
Demographics Similar to Austrians by Unemployment Among Ages 25 to 29 years
In terms of unemployment among ages 25 to 29 years, the demographic groups most similar to Austrians are Immigrants from Belgium (6.5%, a difference of 0.0%), Immigrants from Pakistan (6.5%, a difference of 0.0%), Eastern European (6.5%, a difference of 0.020%), Maltese (6.5%, a difference of 0.070%), and Slavic (6.5%, a difference of 0.10%).
| Demographics | Rating | Rank | Unemployment Among Ages 25 to 29 years |
| Poles | 76.6 /100 | #132 | Good 6.5% |
| Immigrants | Europe | 75.7 /100 | #133 | Good 6.5% |
| Immigrants | Vietnam | 75.6 /100 | #134 | Good 6.5% |
| Immigrants | Croatia | 75.5 /100 | #135 | Good 6.5% |
| Northern Europeans | 75.4 /100 | #136 | Good 6.5% |
| Eastern Europeans | 74.1 /100 | #137 | Good 6.5% |
| Immigrants | Belgium | 73.8 /100 | #138 | Good 6.5% |
| Austrians | 73.8 /100 | #139 | Good 6.5% |
| Immigrants | Pakistan | 73.8 /100 | #140 | Good 6.5% |
| Maltese | 72.9 /100 | #141 | Good 6.5% |
| Slavs | 72.5 /100 | #142 | Good 6.5% |
| Lithuanians | 72.2 /100 | #143 | Good 6.5% |
| Immigrants | Micronesia | 71.5 /100 | #144 | Good 6.6% |
| Nicaraguans | 70.2 /100 | #145 | Good 6.6% |
| Romanians | 69.5 /100 | #146 | Good 6.6% |
Demographics Similar to Australians by Unemployment Among Ages 25 to 29 years
In terms of unemployment among ages 25 to 29 years, the demographic groups most similar to Australians are Immigrants from North Macedonia (6.4%, a difference of 0.0%), Zimbabwean (6.4%, a difference of 0.050%), Egyptian (6.4%, a difference of 0.060%), Lebanese (6.4%, a difference of 0.070%), and Immigrants from Oceania (6.4%, a difference of 0.14%).
| Demographics | Rating | Rank | Unemployment Among Ages 25 to 29 years |
| Immigrants | Asia | 94.9 /100 | #86 | Exceptional 6.3% |
| Marshallese | 94.7 /100 | #87 | Exceptional 6.4% |
| Immigrants | Indonesia | 94.5 /100 | #88 | Exceptional 6.4% |
| Immigrants | Oceania | 94.1 /100 | #89 | Exceptional 6.4% |
| Lebanese | 93.9 /100 | #90 | Exceptional 6.4% |
| Egyptians | 93.9 /100 | #91 | Exceptional 6.4% |
| Immigrants | North Macedonia | 93.6 /100 | #92 | Exceptional 6.4% |
| Australians | 93.6 /100 | #93 | Exceptional 6.4% |
| Zimbabweans | 93.5 /100 | #94 | Exceptional 6.4% |
| Afghans | 92.5 /100 | #95 | Exceptional 6.4% |
| Immigrants | Brazil | 92.1 /100 | #96 | Exceptional 6.4% |
| Immigrants | Eastern Europe | 91.9 /100 | #97 | Exceptional 6.4% |
| Serbians | 91.7 /100 | #98 | Exceptional 6.4% |
| Iraqis | 91.3 /100 | #99 | Exceptional 6.4% |
| Uruguayans | 91.2 /100 | #100 | Exceptional 6.4% |