Immigrants from Peru vs Spanish Female Unemployment
COMPARE
Immigrants from Peru
Spanish
Female Unemployment
Female Unemployment Comparison
Immigrants from Peru
Spanish
5.5%
FEMALE UNEMPLOYMENT
5.9/ 100
METRIC RATING
226th/ 347
METRIC RANK
5.2%
FEMALE UNEMPLOYMENT
55.9/ 100
METRIC RATING
170th/ 347
METRIC RANK
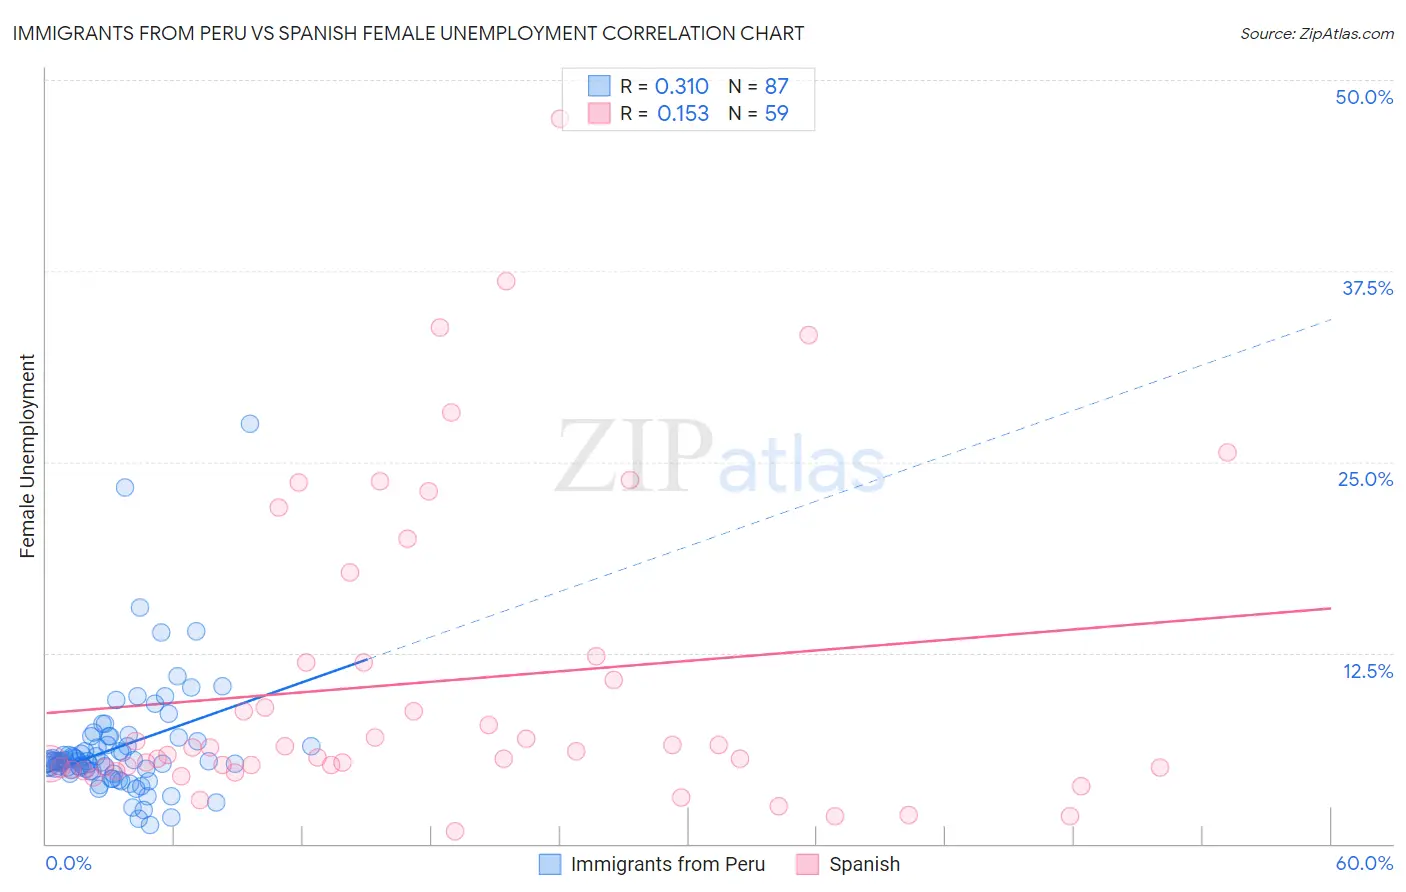
Immigrants from Peru vs Spanish Female Unemployment Correlation Chart
The statistical analysis conducted on geographies consisting of 328,076,387 people shows a mild positive correlation between the proportion of Immigrants from Peru and unemploymnet rate among females in the United States with a correlation coefficient (R) of 0.310 and weighted average of 5.5%. Similarly, the statistical analysis conducted on geographies consisting of 419,412,543 people shows a poor positive correlation between the proportion of Spanish and unemploymnet rate among females in the United States with a correlation coefficient (R) of 0.153 and weighted average of 5.2%, a difference of 4.5%.
Female Unemployment Correlation Summary
| Measurement | Immigrants from Peru | Spanish |
| Minimum | 1.2% | 0.80% |
| Maximum | 27.5% | 47.5% |
| Range | 26.3% | 46.7% |
| Mean | 6.3% | 10.6% |
| Median | 5.4% | 6.1% |
| Interquartile 25% (IQ1) | 4.7% | 5.0% |
| Interquartile 75% (IQ3) | 6.7% | 11.9% |
| Interquartile Range (IQR) | 2.0% | 6.9% |
| Standard Deviation (Sample) | 3.9% | 10.1% |
| Standard Deviation (Population) | 3.8% | 10.0% |
Similar Demographics by Female Unemployment
Demographics Similar to Immigrants from Peru by Female Unemployment
In terms of female unemployment, the demographic groups most similar to Immigrants from Peru are French American Indian (5.5%, a difference of 0.040%), Immigrants from Philippines (5.5%, a difference of 0.17%), Iraqi (5.5%, a difference of 0.27%), Delaware (5.5%, a difference of 0.30%), and Nicaraguan (5.5%, a difference of 0.31%).
| Demographics | Rating | Rank | Female Unemployment |
| South Americans | 8.6 /100 | #219 | Tragic 5.4% |
| Immigrants | Africa | 8.5 /100 | #220 | Tragic 5.4% |
| Brazilians | 7.3 /100 | #221 | Tragic 5.5% |
| Nicaraguans | 7.2 /100 | #222 | Tragic 5.5% |
| Delaware | 7.2 /100 | #223 | Tragic 5.5% |
| Iraqis | 7.1 /100 | #224 | Tragic 5.5% |
| French American Indians | 6.1 /100 | #225 | Tragic 5.5% |
| Immigrants | Peru | 5.9 /100 | #226 | Tragic 5.5% |
| Immigrants | Philippines | 5.3 /100 | #227 | Tragic 5.5% |
| Israelis | 4.8 /100 | #228 | Tragic 5.5% |
| Panamanians | 4.7 /100 | #229 | Tragic 5.5% |
| Immigrants | Uruguay | 4.7 /100 | #230 | Tragic 5.5% |
| Immigrants | Iraq | 3.9 /100 | #231 | Tragic 5.5% |
| Liberians | 3.9 /100 | #232 | Tragic 5.5% |
| Moroccans | 3.4 /100 | #233 | Tragic 5.5% |
Demographics Similar to Spanish by Female Unemployment
In terms of female unemployment, the demographic groups most similar to Spanish are Immigrants from Denmark (5.2%, a difference of 0.050%), Immigrants from Chile (5.2%, a difference of 0.19%), Sri Lankan (5.2%, a difference of 0.22%), Immigrants from Uganda (5.3%, a difference of 0.31%), and Iranian (5.3%, a difference of 0.33%).
| Demographics | Rating | Rank | Female Unemployment |
| Immigrants | Asia | 64.3 /100 | #163 | Good 5.2% |
| Bangladeshis | 64.3 /100 | #164 | Good 5.2% |
| Syrians | 62.8 /100 | #165 | Good 5.2% |
| Native Hawaiians | 62.7 /100 | #166 | Good 5.2% |
| Immigrants | Thailand | 62.1 /100 | #167 | Good 5.2% |
| Sri Lankans | 59.4 /100 | #168 | Average 5.2% |
| Immigrants | Chile | 59.0 /100 | #169 | Average 5.2% |
| Spanish | 55.9 /100 | #170 | Average 5.2% |
| Immigrants | Denmark | 55.0 /100 | #171 | Average 5.2% |
| Immigrants | Uganda | 50.7 /100 | #172 | Average 5.3% |
| Iranians | 50.4 /100 | #173 | Average 5.3% |
| Immigrants | Poland | 50.0 /100 | #174 | Average 5.3% |
| Immigrants | Laos | 47.5 /100 | #175 | Average 5.3% |
| Immigrants | Vietnam | 47.5 /100 | #176 | Average 5.3% |
| Immigrants | Morocco | 47.4 /100 | #177 | Average 5.3% |