Immigrants from Trinidad and Tobago vs Alsatian Unemployment Among Ages 55 to 59 years
COMPARE
Immigrants from Trinidad and Tobago
Alsatian
Unemployment Among Ages 55 to 59 years
Unemployment Among Ages 55 to 59 years Comparison
Immigrants from Trinidad and Tobago
Alsatians
5.3%
UNEMPLOYMENT AMONG AGES 55 TO 59 YEARS
0.0/ 100
METRIC RATING
282nd/ 347
METRIC RANK
5.2%
UNEMPLOYMENT AMONG AGES 55 TO 59 YEARS
0.0/ 100
METRIC RATING
279th/ 347
METRIC RANK
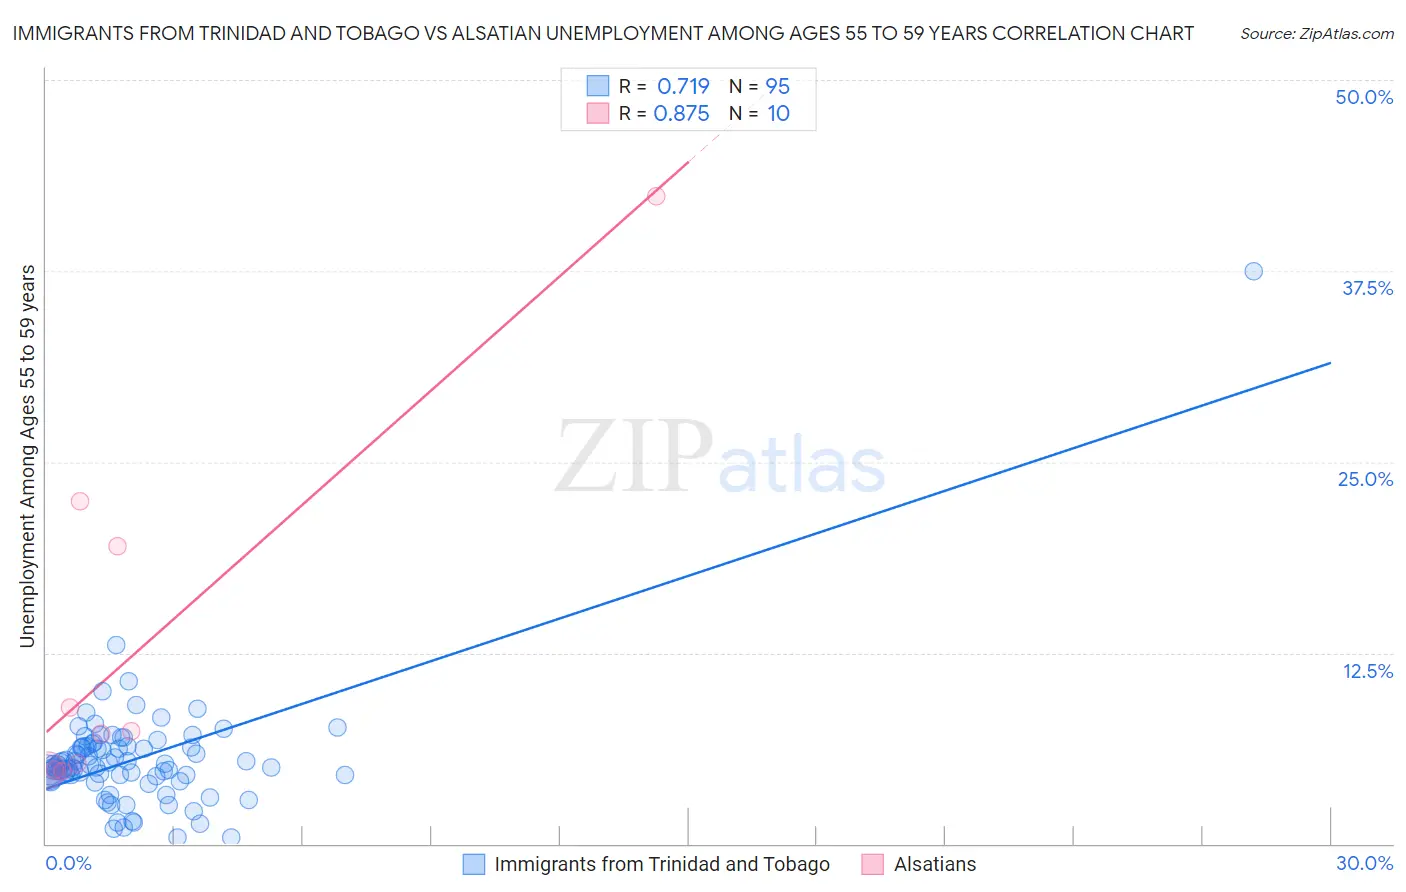
Immigrants from Trinidad and Tobago vs Alsatian Unemployment Among Ages 55 to 59 years Correlation Chart
The statistical analysis conducted on geographies consisting of 215,210,978 people shows a strong positive correlation between the proportion of Immigrants from Trinidad and Tobago and unemployment rate among population between the ages 55 and 59 in the United States with a correlation coefficient (R) of 0.719 and weighted average of 5.3%. Similarly, the statistical analysis conducted on geographies consisting of 80,463,292 people shows a very strong positive correlation between the proportion of Alsatians and unemployment rate among population between the ages 55 and 59 in the United States with a correlation coefficient (R) of 0.875 and weighted average of 5.2%, a difference of 0.62%.
Unemployment Among Ages 55 to 59 years Correlation Summary
| Measurement | Immigrants from Trinidad and Tobago | Alsatian |
| Minimum | 0.40% | 4.7% |
| Maximum | 37.5% | 42.4% |
| Range | 37.1% | 37.7% |
| Mean | 5.5% | 12.7% |
| Median | 5.0% | 7.3% |
| Interquartile 25% (IQ1) | 4.5% | 4.8% |
| Interquartile 75% (IQ3) | 6.3% | 19.5% |
| Interquartile Range (IQR) | 1.9% | 14.7% |
| Standard Deviation (Sample) | 4.0% | 12.2% |
| Standard Deviation (Population) | 3.9% | 11.6% |
Demographics Similar to Immigrants from Trinidad and Tobago and Alsatians by Unemployment Among Ages 55 to 59 years
In terms of unemployment among ages 55 to 59 years, the demographic groups most similar to Immigrants from Trinidad and Tobago are Apache (5.3%, a difference of 0.030%), Ghanaian (5.3%, a difference of 0.080%), Armenian (5.3%, a difference of 0.17%), Guatemalan (5.3%, a difference of 0.27%), and Immigrants from Ghana (5.3%, a difference of 0.29%). Similarly, the demographic groups most similar to Alsatians are Immigrants from Barbados (5.2%, a difference of 0.11%), Immigrants from Uzbekistan (5.3%, a difference of 0.21%), Immigrants from Latin America (5.2%, a difference of 0.29%), Guatemalan (5.3%, a difference of 0.36%), and West Indian (5.2%, a difference of 0.41%).
| Demographics | Rating | Rank | Unemployment Among Ages 55 to 59 years |
| Ute | 0.1 /100 | #270 | Tragic 5.2% |
| Cree | 0.1 /100 | #271 | Tragic 5.2% |
| Immigrants | Jamaica | 0.0 /100 | #272 | Tragic 5.2% |
| Ottawa | 0.0 /100 | #273 | Tragic 5.2% |
| Mexican American Indians | 0.0 /100 | #274 | Tragic 5.2% |
| Israelis | 0.0 /100 | #275 | Tragic 5.2% |
| West Indians | 0.0 /100 | #276 | Tragic 5.2% |
| Immigrants | Latin America | 0.0 /100 | #277 | Tragic 5.2% |
| Immigrants | Barbados | 0.0 /100 | #278 | Tragic 5.2% |
| Alsatians | 0.0 /100 | #279 | Tragic 5.2% |
| Immigrants | Uzbekistan | 0.0 /100 | #280 | Tragic 5.3% |
| Guatemalans | 0.0 /100 | #281 | Tragic 5.3% |
| Immigrants | Trinidad and Tobago | 0.0 /100 | #282 | Tragic 5.3% |
| Apache | 0.0 /100 | #283 | Tragic 5.3% |
| Ghanaians | 0.0 /100 | #284 | Tragic 5.3% |
| Armenians | 0.0 /100 | #285 | Tragic 5.3% |
| Immigrants | Ghana | 0.0 /100 | #286 | Tragic 5.3% |
| Immigrants | Guatemala | 0.0 /100 | #287 | Tragic 5.3% |
| Immigrants | Israel | 0.0 /100 | #288 | Tragic 5.3% |
| Immigrants | Central America | 0.0 /100 | #289 | Tragic 5.3% |
| Sioux | 0.0 /100 | #290 | Tragic 5.3% |