Paraguayan vs Puerto Rican Unemployment Among Ages 20 to 24 years
COMPARE
Paraguayan
Puerto Rican
Unemployment Among Ages 20 to 24 years
Unemployment Among Ages 20 to 24 years Comparison
Paraguayans
Puerto Ricans
10.1%
UNEMPLOYMENT AMONG AGES 20 TO 24 YEARS
88.6/ 100
METRIC RATING
118th/ 347
METRIC RANK
16.7%
UNEMPLOYMENT AMONG AGES 20 TO 24 YEARS
0.0/ 100
METRIC RATING
342nd/ 347
METRIC RANK
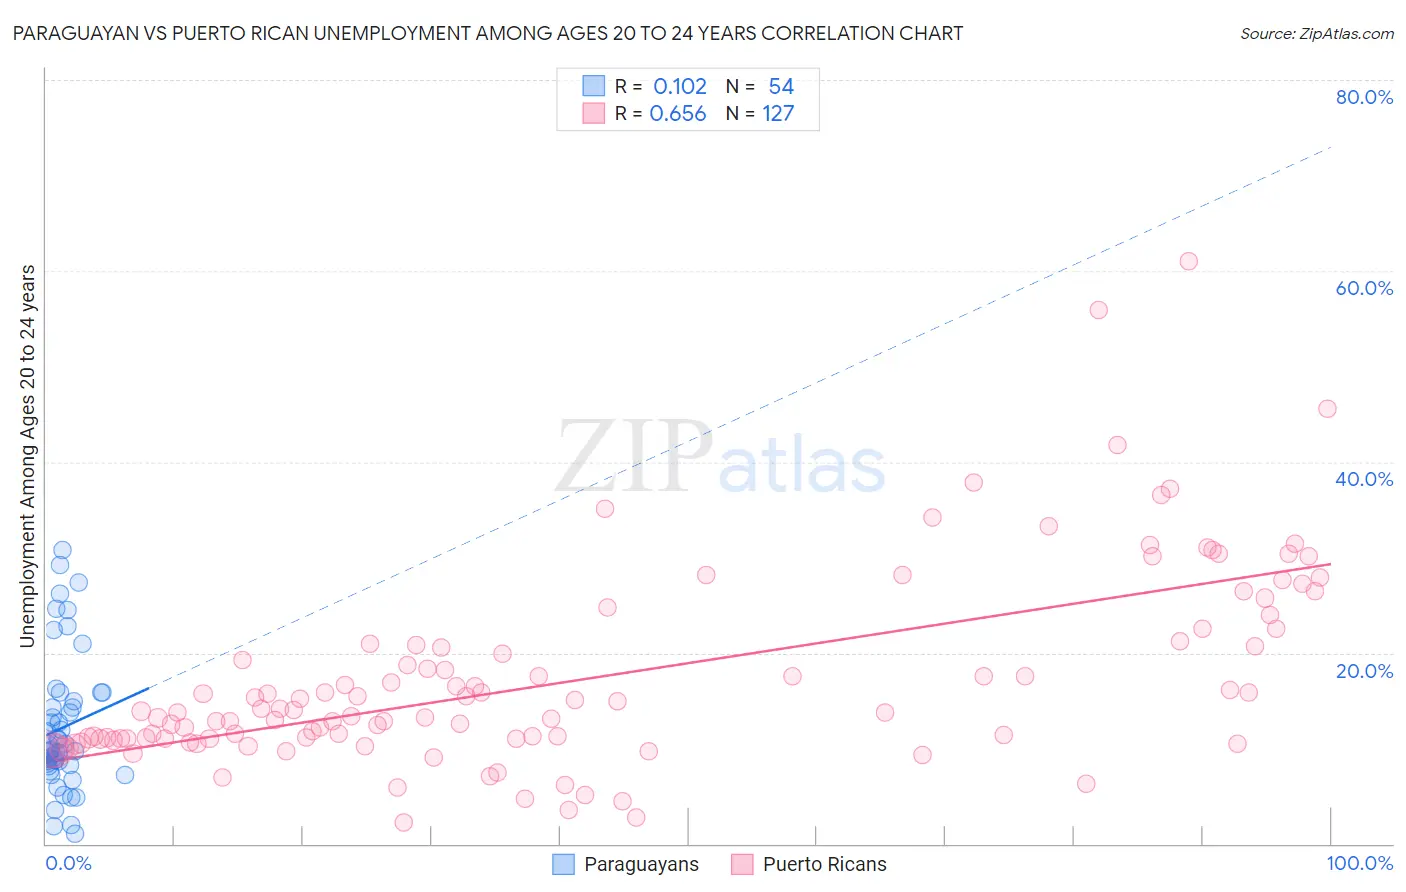
Paraguayan vs Puerto Rican Unemployment Among Ages 20 to 24 years Correlation Chart
The statistical analysis conducted on geographies consisting of 94,460,414 people shows a poor positive correlation between the proportion of Paraguayans and unemployment rate among population between the ages 20 and 24 in the United States with a correlation coefficient (R) of 0.102 and weighted average of 10.1%. Similarly, the statistical analysis conducted on geographies consisting of 498,686,808 people shows a significant positive correlation between the proportion of Puerto Ricans and unemployment rate among population between the ages 20 and 24 in the United States with a correlation coefficient (R) of 0.656 and weighted average of 16.7%, a difference of 64.7%.
Unemployment Among Ages 20 to 24 years Correlation Summary
| Measurement | Paraguayan | Puerto Rican |
| Minimum | 1.0% | 2.3% |
| Maximum | 30.8% | 61.0% |
| Range | 29.8% | 58.7% |
| Mean | 12.2% | 17.3% |
| Median | 9.8% | 13.9% |
| Interquartile 25% (IQ1) | 8.2% | 11.0% |
| Interquartile 75% (IQ3) | 14.9% | 21.0% |
| Interquartile Range (IQR) | 6.7% | 10.0% |
| Standard Deviation (Sample) | 7.0% | 10.2% |
| Standard Deviation (Population) | 7.0% | 10.1% |
Similar Demographics by Unemployment Among Ages 20 to 24 years
Demographics Similar to Paraguayans by Unemployment Among Ages 20 to 24 years
In terms of unemployment among ages 20 to 24 years, the demographic groups most similar to Paraguayans are French (10.1%, a difference of 0.030%), Immigrants from Canada (10.1%, a difference of 0.040%), South African (10.1%, a difference of 0.070%), Immigrants from Uruguay (10.1%, a difference of 0.10%), and Basque (10.1%, a difference of 0.11%).
| Demographics | Rating | Rank | Unemployment Among Ages 20 to 24 years |
| Immigrants | Indonesia | 92.7 /100 | #111 | Exceptional 10.1% |
| Northern Europeans | 92.7 /100 | #112 | Exceptional 10.1% |
| German Russians | 92.4 /100 | #113 | Exceptional 10.1% |
| Ottawa | 90.8 /100 | #114 | Exceptional 10.1% |
| Immigrants | Morocco | 90.5 /100 | #115 | Exceptional 10.1% |
| Basques | 89.8 /100 | #116 | Excellent 10.1% |
| Immigrants | Uruguay | 89.6 /100 | #117 | Excellent 10.1% |
| Paraguayans | 88.6 /100 | #118 | Excellent 10.1% |
| French | 88.2 /100 | #119 | Excellent 10.1% |
| Immigrants | Canada | 88.2 /100 | #120 | Excellent 10.1% |
| South Africans | 87.8 /100 | #121 | Excellent 10.1% |
| Whites/Caucasians | 87.4 /100 | #122 | Excellent 10.1% |
| Immigrants | Iraq | 87.1 /100 | #123 | Excellent 10.1% |
| Immigrants | Japan | 86.5 /100 | #124 | Excellent 10.1% |
| Spanish | 86.1 /100 | #125 | Excellent 10.1% |
Demographics Similar to Puerto Ricans by Unemployment Among Ages 20 to 24 years
In terms of unemployment among ages 20 to 24 years, the demographic groups most similar to Puerto Ricans are Navajo (16.1%, a difference of 3.2%), Yuman (15.8%, a difference of 5.1%), Tsimshian (18.0%, a difference of 8.0%), Immigrants from Yemen (14.9%, a difference of 11.9%), and Crow (18.7%, a difference of 12.5%).
| Demographics | Rating | Rank | Unemployment Among Ages 20 to 24 years |
| Immigrants | Guyana | 0.0 /100 | #333 | Tragic 13.9% |
| Guyanese | 0.0 /100 | #334 | Tragic 14.0% |
| Sioux | 0.0 /100 | #335 | Tragic 14.2% |
| Pima | 0.0 /100 | #336 | Tragic 14.2% |
| Paiute | 0.0 /100 | #337 | Tragic 14.3% |
| Immigrants | St. Vincent and the Grenadines | 0.0 /100 | #338 | Tragic 14.3% |
| Immigrants | Yemen | 0.0 /100 | #339 | Tragic 14.9% |
| Yuman | 0.0 /100 | #340 | Tragic 15.8% |
| Navajo | 0.0 /100 | #341 | Tragic 16.1% |
| Puerto Ricans | 0.0 /100 | #342 | Tragic 16.7% |
| Tsimshian | 0.0 /100 | #343 | Tragic 18.0% |
| Crow | 0.0 /100 | #344 | Tragic 18.7% |
| Hopi | 0.0 /100 | #345 | Tragic 19.9% |
| Yup'ik | 0.0 /100 | #346 | Tragic 20.9% |
| Inupiat | 0.0 /100 | #347 | Tragic 20.9% |