Immigrants from Norway vs Immigrants from Austria Unemployment Among Ages 60 to 64 years
COMPARE
Immigrants from Norway
Immigrants from Austria
Unemployment Among Ages 60 to 64 years
Unemployment Among Ages 60 to 64 years Comparison
Immigrants from Norway
Immigrants from Austria
4.8%
UNEMPLOYMENT AMONG AGES 60 TO 64 YEARS
65.1/ 100
METRIC RATING
161st/ 347
METRIC RANK
4.9%
UNEMPLOYMENT AMONG AGES 60 TO 64 YEARS
26.6/ 100
METRIC RATING
195th/ 347
METRIC RANK
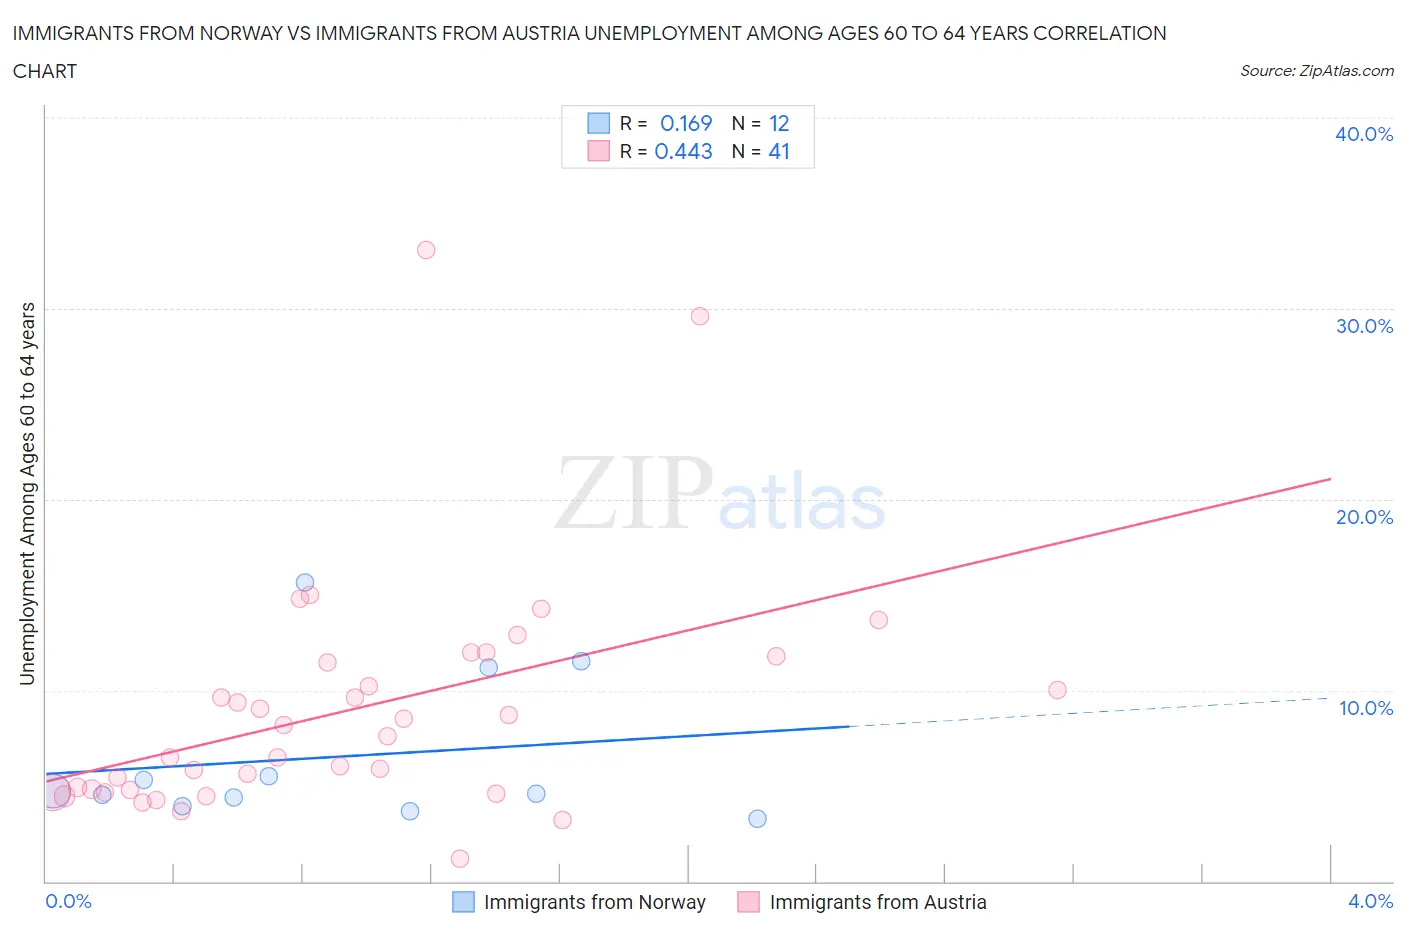
Immigrants from Norway vs Immigrants from Austria Unemployment Among Ages 60 to 64 years Correlation Chart
The statistical analysis conducted on geographies consisting of 111,900,963 people shows a poor positive correlation between the proportion of Immigrants from Norway and unemployment rate among population between the ages 60 and 64 in the United States with a correlation coefficient (R) of 0.169 and weighted average of 4.8%. Similarly, the statistical analysis conducted on geographies consisting of 161,133,205 people shows a moderate positive correlation between the proportion of Immigrants from Austria and unemployment rate among population between the ages 60 and 64 in the United States with a correlation coefficient (R) of 0.443 and weighted average of 4.9%, a difference of 1.5%.
Unemployment Among Ages 60 to 64 years Correlation Summary
| Measurement | Immigrants from Norway | Immigrants from Austria |
| Minimum | 3.3% | 1.2% |
| Maximum | 15.7% | 33.1% |
| Range | 12.4% | 31.9% |
| Mean | 6.5% | 8.9% |
| Median | 4.7% | 7.6% |
| Interquartile 25% (IQ1) | 4.2% | 4.7% |
| Interquartile 75% (IQ3) | 8.3% | 11.6% |
| Interquartile Range (IQR) | 4.2% | 6.9% |
| Standard Deviation (Sample) | 4.0% | 6.2% |
| Standard Deviation (Population) | 3.8% | 6.2% |
Similar Demographics by Unemployment Among Ages 60 to 64 years
Demographics Similar to Immigrants from Norway by Unemployment Among Ages 60 to 64 years
In terms of unemployment among ages 60 to 64 years, the demographic groups most similar to Immigrants from Norway are South African (4.8%, a difference of 0.0%), Australian (4.8%, a difference of 0.010%), Immigrants from Belgium (4.8%, a difference of 0.010%), Spanish (4.8%, a difference of 0.020%), and Pakistani (4.8%, a difference of 0.020%).
| Demographics | Rating | Rank | Unemployment Among Ages 60 to 64 years |
| Chileans | 72.6 /100 | #154 | Good 4.8% |
| Filipinos | 72.1 /100 | #155 | Good 4.8% |
| Immigrants | Bolivia | 69.2 /100 | #156 | Good 4.8% |
| Laotians | 66.8 /100 | #157 | Good 4.8% |
| Immigrants | Taiwan | 66.0 /100 | #158 | Good 4.8% |
| Spanish | 65.5 /100 | #159 | Good 4.8% |
| Australians | 65.3 /100 | #160 | Good 4.8% |
| Immigrants | Norway | 65.1 /100 | #161 | Good 4.8% |
| South Africans | 65.1 /100 | #162 | Good 4.8% |
| Immigrants | Belgium | 64.8 /100 | #163 | Good 4.8% |
| Pakistanis | 64.6 /100 | #164 | Good 4.8% |
| Immigrants | Panama | 62.0 /100 | #165 | Good 4.8% |
| Palestinians | 60.5 /100 | #166 | Good 4.8% |
| Immigrants | Northern Europe | 59.1 /100 | #167 | Average 4.8% |
| Immigrants | Southern Europe | 56.7 /100 | #168 | Average 4.8% |
Demographics Similar to Immigrants from Austria by Unemployment Among Ages 60 to 64 years
In terms of unemployment among ages 60 to 64 years, the demographic groups most similar to Immigrants from Austria are Immigrants from Colombia (4.9%, a difference of 0.010%), Immigrants from Asia (4.9%, a difference of 0.040%), Immigrants from Eastern Europe (4.9%, a difference of 0.070%), Houma (4.9%, a difference of 0.080%), and Menominee (4.9%, a difference of 0.10%).
| Demographics | Rating | Rank | Unemployment Among Ages 60 to 64 years |
| Nicaraguans | 30.4 /100 | #188 | Fair 4.9% |
| Immigrants | Nicaragua | 29.8 /100 | #189 | Fair 4.9% |
| Immigrants | Europe | 29.8 /100 | #190 | Fair 4.9% |
| Immigrants | Nigeria | 29.6 /100 | #191 | Fair 4.9% |
| Menominee | 28.8 /100 | #192 | Fair 4.9% |
| Houma | 28.3 /100 | #193 | Fair 4.9% |
| Immigrants | Colombia | 26.8 /100 | #194 | Fair 4.9% |
| Immigrants | Austria | 26.6 /100 | #195 | Fair 4.9% |
| Immigrants | Asia | 25.7 /100 | #196 | Fair 4.9% |
| Immigrants | Eastern Europe | 25.2 /100 | #197 | Fair 4.9% |
| Guamanians/Chamorros | 23.7 /100 | #198 | Fair 4.9% |
| Immigrants | Vietnam | 23.7 /100 | #199 | Fair 4.9% |
| Immigrants | Czechoslovakia | 23.5 /100 | #200 | Fair 4.9% |
| Colombians | 22.7 /100 | #201 | Fair 4.9% |
| Immigrants | Western Africa | 20.6 /100 | #202 | Fair 4.9% |