Immigrants from Honduras vs Immigrants from Japan Unemployment Among Ages 55 to 59 years

COMPARE

Immigrants from Honduras
Race
Ancestry
AfghanAfricanAlaska NativeAlaskan AthabascanAlbanianAleutAlsatianAmericanApacheArabArapahoArgentineanArmenianAssyrian/Chaldean/SyriacAustralianAustrianBahamianBangladeshiBarbadianBasqueBelgianBelizeanBermudanBhutaneseBlackfeetBolivianBrazilianBritishBritish West IndianBulgarianBurmeseCajunCambodianCanadianCape VerdeanCarpatho RusynCelticCentral AmericanCentral American IndianCherokeeCheyenneChickasawChileanChineseChippewaChoctawColombianColvilleComancheCosta RicanCreeCreekCroatianCrowCubanCypriotCzechCzechoslovakianDanishDelawareDominicanDutchDutch West IndianEastern EuropeanEcuadorianEgyptianEnglishEstonianEthiopianEuropeanFijianFilipinoFinnishFrenchFrench American IndianFrench CanadianGermanGerman RussianGhanaianGreekGuamanian/ChamorroGuatemalanGuyaneseHaitianHmongHonduranHopiHoumaHungarianIcelanderIndian (Asian)IndonesianInupiatIranianIraqiIrishIroquoisIsraeliItalianJamaicanJapaneseJordanianKenyanKiowaKoreanLaotianLatvianLebaneseLiberianLithuanianLumbeeLuxembourgerMacedonianMalaysianMalteseMarshalleseMenomineeMexicanMexican American IndianMongolianMoroccanNative HawaiianNavajoNepaleseNew ZealanderNicaraguanNigerianNorthern EuropeanNorwegianOkinawanOsageOttawaPaiutePakistaniPalestinianPanamanianParaguayanPennsylvania GermanPeruvianPimaPolishPortuguesePotawatomiPuebloPuerto RicanPuget Sound SalishRomanianRussianSalvadoranSamoanScandinavianScotch-IrishScottishSeminoleSenegaleseSerbianShoshoneSierra LeoneanSiouxSlavicSlovakSloveneSomaliSouth AfricanSouth AmericanSouth American IndianSoviet UnionSpaniardSpanishSpanish AmericanSpanish American IndianSri LankanSubsaharan AfricanSudaneseSwedishSwissSyrianTaiwaneseThaiTlingit-HaidaTohono O'OdhamTonganTrinidadian and TobagonianTsimshianTurkishU.S. Virgin IslanderUgandanUkrainianUruguayanUteVenezuelanVietnameseWelshWest IndianYakamaYaquiYugoslavianYumanYup'ikZimbabwean
Immigration
NonimmigrantsImmigrantsAfghanistanAfricaAlbaniaArgentinaArmeniaAsiaAustraliaAustriaBahamasBangladeshBarbadosBelarusBelgiumBelizeBoliviaBosnia and HerzegovinaBrazilBulgariaBurma/MyanmarCabo VerdeCambodiaCameroonCanadaCaribbeanCentral AmericaChileChinaColombiaCongoCosta RicaCroatiaCubaCzechoslovakiaDenmarkDominicaDominican RepublicEastern AfricaEastern AsiaEastern EuropeEcuadorEgyptEl SalvadorEnglandEritreaEthiopiaEuropeFijiFranceGermanyGhanaGreeceGrenadaGuatemalaGuyanaHaitiHondurasHong KongHungaryIndiaIndonesiaIranIraqIrelandIsraelItalyJamaicaJordanKazakhstanKenyaKoreaKuwaitLaosLatin AmericaLatviaLebanonLiberiaLithuaniaMalaysiaMexicoMicronesiaMiddle AfricaMoldovaMoroccoNepalNetherlandsNicaraguaNigeriaNorth AmericaNorth MacedoniaNorthern AfricaNorthern EuropeNorwayOceaniaPakistanPanamaPeruPhilippinesPolandPortugalRomaniaRussiaSaudi ArabiaScotlandSenegalSerbiaSierra LeoneSingaporeSomaliaSouth AfricaSouth AmericaSouth Central AsiaSouth Eastern AsiaSouthern EuropeSpainSri LankaSt. Vincent and the GrenadinesSudanSwedenSwitzerlandSyriaTaiwanThailandTrinidad and TobagoTurkeyUgandaUkraineUruguayUzbekistanVenezuelaVietnamWest IndiesWestern AfricaWestern AsiaWestern EuropeYemenZaireZimbabweAzores
Immigrants from Japan
Race
Ancestry
AfghanAfricanAlaska NativeAlaskan AthabascanAlbanianAleutAlsatianAmericanApacheArabArapahoArgentineanArmenianAssyrian/Chaldean/SyriacAustralianAustrianBahamianBangladeshiBarbadianBasqueBelgianBelizeanBermudanBhutaneseBlackfeetBolivianBrazilianBritishBritish West IndianBulgarianBurmeseCajunCambodianCanadianCape VerdeanCarpatho RusynCelticCentral AmericanCentral American IndianCherokeeCheyenneChickasawChileanChineseChippewaChoctawColombianColvilleComancheCosta RicanCreeCreekCroatianCrowCubanCypriotCzechCzechoslovakianDanishDelawareDominicanDutchDutch West IndianEastern EuropeanEcuadorianEgyptianEnglishEstonianEthiopianEuropeanFijianFilipinoFinnishFrenchFrench American IndianFrench CanadianGermanGerman RussianGhanaianGreekGuamanian/ChamorroGuatemalanGuyaneseHaitianHmongHonduranHopiHoumaHungarianIcelanderIndian (Asian)IndonesianInupiatIranianIraqiIrishIroquoisIsraeliItalianJamaicanJapaneseJordanianKenyanKiowaKoreanLaotianLatvianLebaneseLiberianLithuanianLumbeeLuxembourgerMacedonianMalaysianMalteseMarshalleseMenomineeMexicanMexican American IndianMongolianMoroccanNative HawaiianNavajoNepaleseNew ZealanderNicaraguanNigerianNorthern EuropeanNorwegianOkinawanOsageOttawaPaiutePakistaniPalestinianPanamanianParaguayanPennsylvania GermanPeruvianPimaPolishPortuguesePotawatomiPuebloPuerto RicanPuget Sound SalishRomanianRussianSalvadoranSamoanScandinavianScotch-IrishScottishSeminoleSenegaleseSerbianShoshoneSierra LeoneanSiouxSlavicSlovakSloveneSomaliSouth AfricanSouth AmericanSouth American IndianSoviet UnionSpaniardSpanishSpanish AmericanSpanish American IndianSri LankanSubsaharan AfricanSudaneseSwedishSwissSyrianTaiwaneseThaiTlingit-HaidaTohono O'OdhamTonganTrinidadian and TobagonianTsimshianTurkishU.S. Virgin IslanderUgandanUkrainianUruguayanUteVenezuelanVietnameseWelshWest IndianYakamaYaquiYugoslavianYumanYup'ikZimbabwean
Immigration
NonimmigrantsImmigrantsAfghanistanAfricaAlbaniaArgentinaArmeniaAsiaAustraliaAustriaBahamasBangladeshBarbadosBelarusBelgiumBelizeBoliviaBosnia and HerzegovinaBrazilBulgariaBurma/MyanmarCabo VerdeCambodiaCameroonCanadaCaribbeanCentral AmericaChileChinaColombiaCongoCosta RicaCroatiaCubaCzechoslovakiaDenmarkDominicaDominican RepublicEastern AfricaEastern AsiaEastern EuropeEcuadorEgyptEl SalvadorEnglandEritreaEthiopiaEuropeFijiFranceGermanyGhanaGreeceGrenadaGuatemalaGuyanaHaitiHong KongHungaryIndiaIndonesiaIranIraqIrelandIsraelItalyJamaicaJapanJordanKazakhstanKenyaKoreaKuwaitLaosLatin AmericaLatviaLebanonLiberiaLithuaniaMalaysiaMexicoMicronesiaMiddle AfricaMoldovaMoroccoNepalNetherlandsNicaraguaNigeriaNorth AmericaNorth MacedoniaNorthern AfricaNorthern EuropeNorwayOceaniaPakistanPanamaPeruPhilippinesPolandPortugalRomaniaRussiaSaudi ArabiaScotlandSenegalSerbiaSierra LeoneSingaporeSomaliaSouth AfricaSouth AmericaSouth Central AsiaSouth Eastern AsiaSouthern EuropeSpainSri LankaSt. Vincent and the GrenadinesSudanSwedenSwitzerlandSyriaTaiwanThailandTrinidad and TobagoTurkeyUgandaUkraineUruguayUzbekistanVenezuelaVietnamWest IndiesWestern AfricaWestern AsiaWestern EuropeYemenZaireZimbabweAzores
Unemployment Among Ages 55 to 59 years
Income
Poverty
Unemployment
Labor Participation
Family Structure
Vehicle Availability
Education Level
Disability

Unemployment Among Ages 55 to 59 years Comparison

Immigrants from Honduras

Immigrants from Japan

Tragic
Excellent
5.1%
UNEMPLOYMENT AMONG AGES 55 TO 59 YEARS
0.5/ 100
METRIC RATING
247th/ 347
METRIC RANK
4.7%
UNEMPLOYMENT AMONG AGES 55 TO 59 YEARS
89.4/ 100
METRIC RATING
123rd/ 347
METRIC RANK

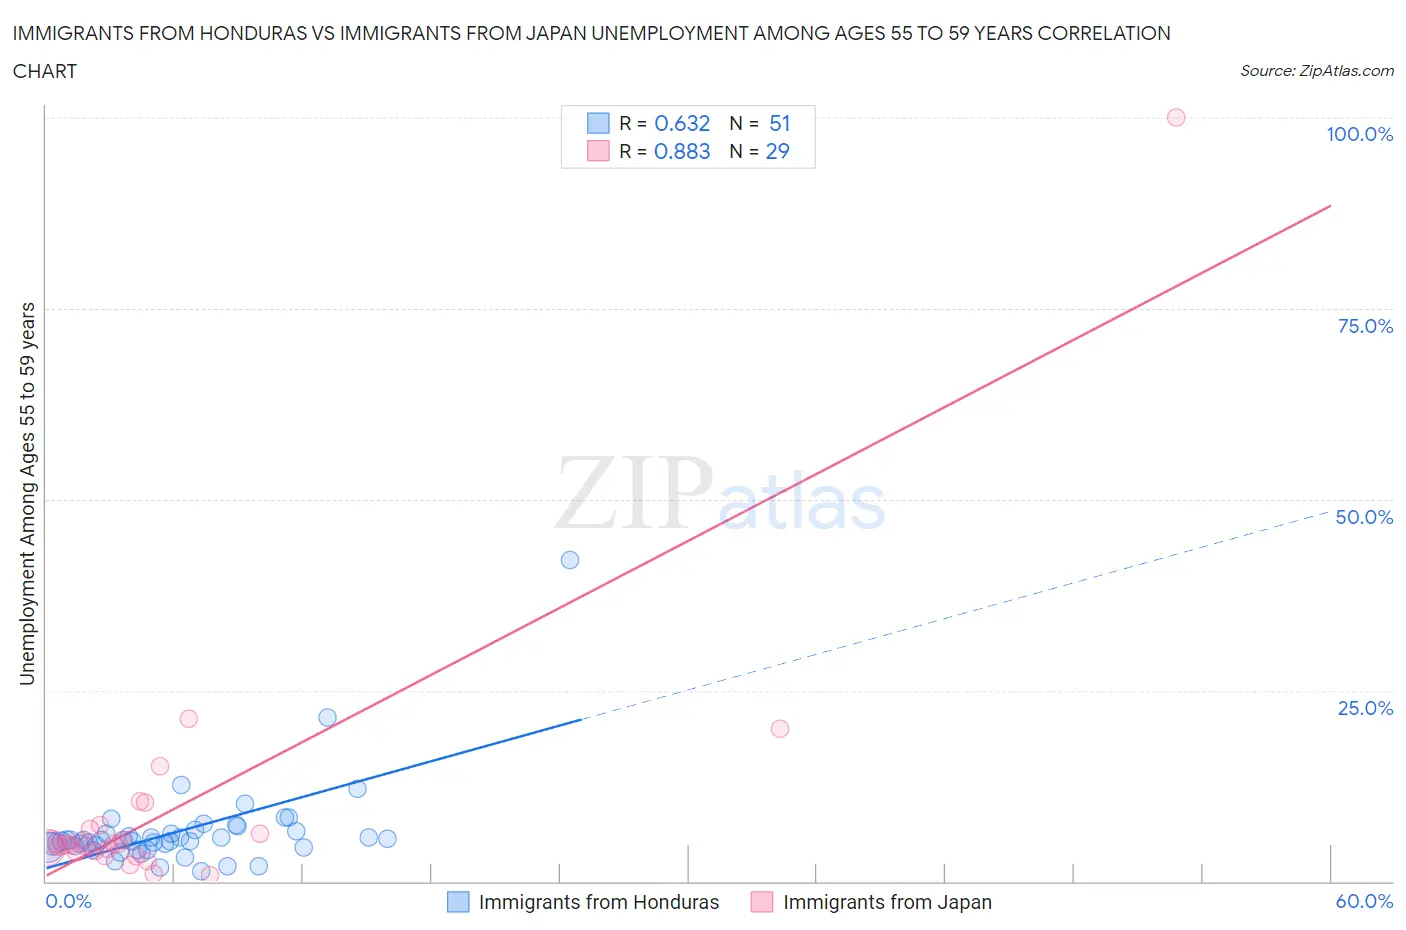
Immigrants from Honduras vs Immigrants from Japan Unemployment Among Ages 55 to 59 years Correlation Chart

The statistical analysis conducted on geographies consisting of 303,249,968 people shows a significant positive correlation between the proportion of Immigrants from Honduras and unemployment rate among population between the ages 55 and 59 in the United States with a correlation coefficient (R) of 0.632 and weighted average of 5.1%. Similarly, the statistical analysis conducted on geographies consisting of 320,972,044 people shows a very strong positive correlation between the proportion of Immigrants from Japan and unemployment rate among population between the ages 55 and 59 in the United States with a correlation coefficient (R) of 0.883 and weighted average of 4.7%, a difference of 7.6%.
Immigrants from Honduras vs Immigrants from Japan Unemployment Among Ages 55 to 59 years

Unemployment Among Ages 55 to 59 years Correlation Summary

MeasurementImmigrants from HondurasImmigrants from Japan
Minimum1.3%0.90%
Maximum42.1%100.0%
Range40.8%99.1%
Mean6.6%9.5%
Median5.3%4.8%
Interquartile 25% (IQ1)4.5%3.9%
Interquartile 75% (IQ3)6.6%7.1%
Interquartile Range (IQR)2.1%3.2%
Standard Deviation (Sample)6.0%18.1%
Standard Deviation (Population)5.9%17.8%

Similar Demographics by Unemployment Among Ages 55 to 59 years

Demographics Similar to Immigrants from Honduras by Unemployment Among Ages 55 to 59 years

In terms of unemployment among ages 55 to 59 years, the demographic groups most similar to Immigrants from Honduras are Immigrants from Greece (5.1%, a difference of 0.010%), Soviet Union (5.1%, a difference of 0.030%), Native Hawaiian (5.1%, a difference of 0.17%), Comanche (5.1%, a difference of 0.20%), and Immigrants from Fiji (5.1%, a difference of 0.24%).
DemographicsRating | RankUnemployment Among Ages 55 to 59 years
Immigrants | Costa Rica
1.1
/100
|
#240
Tragic
5.0%
Brazilians
1.0
/100
|
#241
Tragic
5.0%
Liberians
0.9
/100
|
#242
Tragic
5.1%
Hondurans
0.7
/100
|
#243
Tragic
5.1%
Immigrants | Fiji
0.7
/100
|
#244
Tragic
5.1%
Soviet Union
0.6
/100
|
#245
Tragic
5.1%
Immigrants | Greece
0.6
/100
|
#246
Tragic
5.1%
Immigrants | Honduras
0.5
/100
|
#247
Tragic
5.1%
Native Hawaiians
0.5
/100
|
#248
Tragic
5.1%
Comanche
0.4
/100
|
#249
Tragic
5.1%
Cheyenne
0.4
/100
|
#250
Tragic
5.1%
Portuguese
0.3
/100
|
#251
Tragic
5.1%
U.S. Virgin Islanders
0.3
/100
|
#252
Tragic
5.1%
Paraguayans
0.3
/100
|
#253
Tragic
5.1%
Seminole
0.3
/100
|
#254
Tragic
5.1%

Demographics Similar to Immigrants from Japan by Unemployment Among Ages 55 to 59 years

In terms of unemployment among ages 55 to 59 years, the demographic groups most similar to Immigrants from Japan are Immigrants from Afghanistan (4.7%, a difference of 0.010%), Pakistani (4.7%, a difference of 0.030%), Immigrants from South Africa (4.7%, a difference of 0.050%), Lithuanian (4.7%, a difference of 0.060%), and Immigrants from Chile (4.7%, a difference of 0.15%).
DemographicsRating | RankUnemployment Among Ages 55 to 59 years
Turks
90.9
/100
|
#116
Exceptional
4.7%
Asians
90.8
/100
|
#117
Exceptional
4.7%
Immigrants | Chile
90.7
/100
|
#118
Exceptional
4.7%
Whites/Caucasians
90.7
/100
|
#119
Exceptional
4.7%
Immigrants | South Africa
89.9
/100
|
#120
Excellent
4.7%
Pakistanis
89.7
/100
|
#121
Excellent
4.7%
Immigrants | Afghanistan
89.5
/100
|
#122
Excellent
4.7%
Immigrants | Japan
89.4
/100
|
#123
Excellent
4.7%
Lithuanians
88.8
/100
|
#124
Excellent
4.7%
Immigrants | Malaysia
87.9
/100
|
#125
Excellent
4.7%
Immigrants | Serbia
87.8
/100
|
#126
Excellent
4.7%
Icelanders
87.7
/100
|
#127
Excellent
4.7%
Pennsylvania Germans
87.1
/100
|
#128
Excellent
4.7%
Immigrants | Sweden
86.8
/100
|
#129
Excellent
4.7%
Greeks
86.6
/100
|
#130
Excellent
4.7%