Immigrants from Nigeria vs Hungarian Unemployment Among Ages 16 to 19 years
COMPARE
Immigrants from Nigeria
Hungarian
Unemployment Among Ages 16 to 19 years
Unemployment Among Ages 16 to 19 years Comparison
Immigrants from Nigeria
Hungarians
18.9%
UNEMPLOYMENT AMONG AGES 16 TO 19 YEARS
0.2/ 100
METRIC RATING
257th/ 347
METRIC RANK
17.1%
UNEMPLOYMENT AMONG AGES 16 TO 19 YEARS
91.6/ 100
METRIC RATING
119th/ 347
METRIC RANK
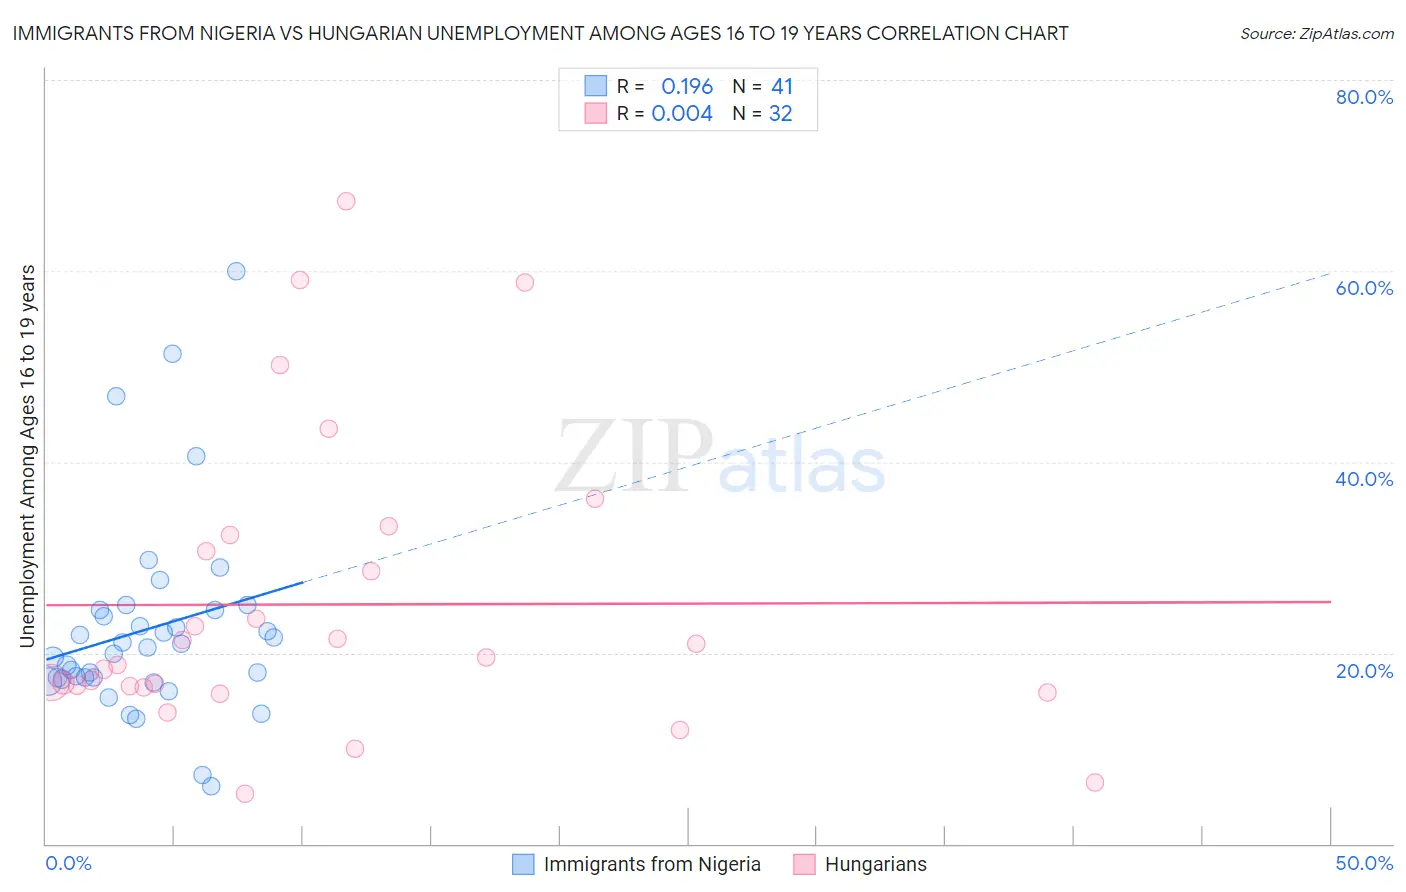
Immigrants from Nigeria vs Hungarian Unemployment Among Ages 16 to 19 years Correlation Chart
The statistical analysis conducted on geographies consisting of 275,738,404 people shows a poor positive correlation between the proportion of Immigrants from Nigeria and unemployment rate among population between the ages 16 and 19 in the United States with a correlation coefficient (R) of 0.196 and weighted average of 18.9%. Similarly, the statistical analysis conducted on geographies consisting of 448,171,361 people shows no correlation between the proportion of Hungarians and unemployment rate among population between the ages 16 and 19 in the United States with a correlation coefficient (R) of 0.004 and weighted average of 17.1%, a difference of 10.4%.
Unemployment Among Ages 16 to 19 years Correlation Summary
| Measurement | Immigrants from Nigeria | Hungarian |
| Minimum | 6.0% | 5.2% |
| Maximum | 60.0% | 67.3% |
| Range | 54.0% | 62.1% |
| Mean | 22.5% | 25.1% |
| Median | 20.5% | 19.1% |
| Interquartile 25% (IQ1) | 17.3% | 16.4% |
| Interquartile 75% (IQ3) | 24.5% | 31.5% |
| Interquartile Range (IQR) | 7.2% | 15.0% |
| Standard Deviation (Sample) | 10.5% | 15.5% |
| Standard Deviation (Population) | 10.4% | 15.2% |
Similar Demographics by Unemployment Among Ages 16 to 19 years
Demographics Similar to Immigrants from Nigeria by Unemployment Among Ages 16 to 19 years
In terms of unemployment among ages 16 to 19 years, the demographic groups most similar to Immigrants from Nigeria are Immigrants from Mexico (18.9%, a difference of 0.14%), Immigrants from Central America (18.9%, a difference of 0.22%), Mexican American Indian (18.8%, a difference of 0.26%), Nigerian (18.9%, a difference of 0.30%), and Immigrants from Cameroon (18.8%, a difference of 0.33%).
| Demographics | Rating | Rank | Unemployment Among Ages 16 to 19 years |
| Panamanians | 0.4 /100 | #250 | Tragic 18.7% |
| Sub-Saharan Africans | 0.4 /100 | #251 | Tragic 18.7% |
| Immigrants | Guatemala | 0.4 /100 | #252 | Tragic 18.7% |
| Central Americans | 0.3 /100 | #253 | Tragic 18.8% |
| Apache | 0.3 /100 | #254 | Tragic 18.8% |
| Immigrants | Cameroon | 0.3 /100 | #255 | Tragic 18.8% |
| Mexican American Indians | 0.3 /100 | #256 | Tragic 18.8% |
| Immigrants | Nigeria | 0.2 /100 | #257 | Tragic 18.9% |
| Immigrants | Mexico | 0.2 /100 | #258 | Tragic 18.9% |
| Immigrants | Central America | 0.2 /100 | #259 | Tragic 18.9% |
| Nigerians | 0.2 /100 | #260 | Tragic 18.9% |
| Spanish American Indians | 0.1 /100 | #261 | Tragic 18.9% |
| Salvadorans | 0.1 /100 | #262 | Tragic 18.9% |
| Cree | 0.1 /100 | #263 | Tragic 19.0% |
| Yaqui | 0.1 /100 | #264 | Tragic 19.0% |
Demographics Similar to Hungarians by Unemployment Among Ages 16 to 19 years
In terms of unemployment among ages 16 to 19 years, the demographic groups most similar to Hungarians are Venezuelan (17.1%, a difference of 0.030%), Immigrants from Sri Lanka (17.1%, a difference of 0.060%), Immigrants from Korea (17.1%, a difference of 0.090%), Brazilian (17.1%, a difference of 0.11%), and Immigrants from Middle Africa (17.1%, a difference of 0.11%).
| Demographics | Rating | Rank | Unemployment Among Ages 16 to 19 years |
| Immigrants | Iraq | 93.7 /100 | #112 | Exceptional 17.0% |
| Icelanders | 93.4 /100 | #113 | Exceptional 17.0% |
| Immigrants | Poland | 93.1 /100 | #114 | Exceptional 17.0% |
| Brazilians | 92.3 /100 | #115 | Exceptional 17.1% |
| Immigrants | Korea | 92.2 /100 | #116 | Exceptional 17.1% |
| Immigrants | Sri Lanka | 92.0 /100 | #117 | Exceptional 17.1% |
| Venezuelans | 91.8 /100 | #118 | Exceptional 17.1% |
| Hungarians | 91.6 /100 | #119 | Exceptional 17.1% |
| Immigrants | Middle Africa | 90.9 /100 | #120 | Exceptional 17.1% |
| Immigrants | Moldova | 90.7 /100 | #121 | Exceptional 17.1% |
| Immigrants | South Eastern Asia | 90.7 /100 | #122 | Exceptional 17.1% |
| Immigrants | Laos | 88.8 /100 | #123 | Excellent 17.1% |
| Syrians | 88.6 /100 | #124 | Excellent 17.1% |
| Immigrants | Germany | 87.7 /100 | #125 | Excellent 17.2% |
| Immigrants | Bolivia | 86.7 /100 | #126 | Excellent 17.2% |