Immigrants from Hong Kong vs Ecuadorian Unemployment Among Ages 45 to 54 years
COMPARE
Immigrants from Hong Kong
Ecuadorian
Unemployment Among Ages 45 to 54 years
Unemployment Among Ages 45 to 54 years Comparison
Immigrants from Hong Kong
Ecuadorians
4.5%
UNEMPLOYMENT AMONG AGES 45 TO 54 YEARS
45.9/ 100
METRIC RATING
184th/ 347
METRIC RANK
5.3%
UNEMPLOYMENT AMONG AGES 45 TO 54 YEARS
0.0/ 100
METRIC RATING
299th/ 347
METRIC RANK
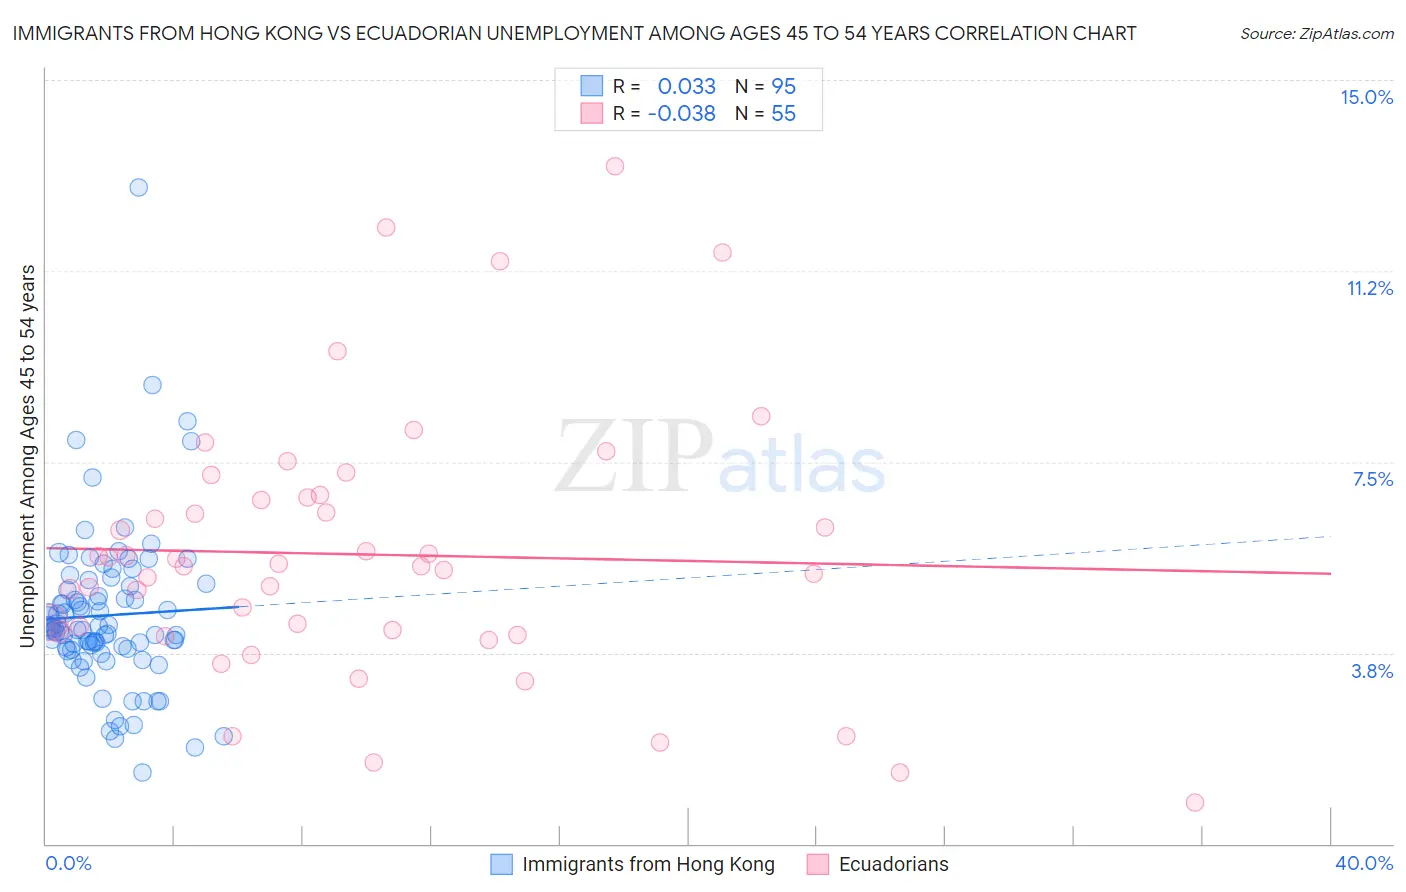
Immigrants from Hong Kong vs Ecuadorian Unemployment Among Ages 45 to 54 years Correlation Chart
The statistical analysis conducted on geographies consisting of 251,096,451 people shows no correlation between the proportion of Immigrants from Hong Kong and unemployment rate among population between the ages 45 and 54 in the United States with a correlation coefficient (R) of 0.033 and weighted average of 4.5%. Similarly, the statistical analysis conducted on geographies consisting of 312,530,580 people shows no correlation between the proportion of Ecuadorians and unemployment rate among population between the ages 45 and 54 in the United States with a correlation coefficient (R) of -0.038 and weighted average of 5.3%, a difference of 16.4%.
Unemployment Among Ages 45 to 54 years Correlation Summary
| Measurement | Immigrants from Hong Kong | Ecuadorian |
| Minimum | 1.4% | 0.80% |
| Maximum | 12.9% | 13.3% |
| Range | 11.5% | 12.5% |
| Mean | 4.5% | 5.7% |
| Median | 4.2% | 5.4% |
| Interquartile 25% (IQ1) | 3.8% | 4.2% |
| Interquartile 75% (IQ3) | 5.1% | 6.8% |
| Interquartile Range (IQR) | 1.2% | 2.6% |
| Standard Deviation (Sample) | 1.6% | 2.6% |
| Standard Deviation (Population) | 1.6% | 2.6% |
Similar Demographics by Unemployment Among Ages 45 to 54 years
Demographics Similar to Immigrants from Hong Kong by Unemployment Among Ages 45 to 54 years
In terms of unemployment among ages 45 to 54 years, the demographic groups most similar to Immigrants from Hong Kong are Immigrants from China (4.5%, a difference of 0.040%), Sierra Leonean (4.5%, a difference of 0.040%), Immigrants from Poland (4.5%, a difference of 0.050%), Malaysian (4.5%, a difference of 0.070%), and Immigrants from Russia (4.5%, a difference of 0.11%).
| Demographics | Rating | Rank | Unemployment Among Ages 45 to 54 years |
| Immigrants | Northern Africa | 49.0 /100 | #177 | Average 4.5% |
| Immigrants | Australia | 48.5 /100 | #178 | Average 4.5% |
| Immigrants | Russia | 48.2 /100 | #179 | Average 4.5% |
| Malaysians | 47.5 /100 | #180 | Average 4.5% |
| Immigrants | Poland | 47.0 /100 | #181 | Average 4.5% |
| Immigrants | China | 46.7 /100 | #182 | Average 4.5% |
| Sierra Leoneans | 46.7 /100 | #183 | Average 4.5% |
| Immigrants | Hong Kong | 45.9 /100 | #184 | Average 4.5% |
| Immigrants | Philippines | 41.0 /100 | #185 | Average 4.5% |
| Hawaiians | 39.1 /100 | #186 | Fair 4.5% |
| Immigrants | Ukraine | 36.8 /100 | #187 | Fair 4.5% |
| Immigrants | Sierra Leone | 36.3 /100 | #188 | Fair 4.6% |
| Immigrants | Laos | 35.7 /100 | #189 | Fair 4.6% |
| Immigrants | Serbia | 34.8 /100 | #190 | Fair 4.6% |
| Immigrants | Uruguay | 34.4 /100 | #191 | Fair 4.6% |
Demographics Similar to Ecuadorians by Unemployment Among Ages 45 to 54 years
In terms of unemployment among ages 45 to 54 years, the demographic groups most similar to Ecuadorians are Immigrants from Trinidad and Tobago (5.3%, a difference of 0.020%), Aleut (5.3%, a difference of 0.14%), West Indian (5.3%, a difference of 0.14%), Central American Indian (5.3%, a difference of 0.21%), and Jamaican (5.3%, a difference of 0.33%).
| Demographics | Rating | Rank | Unemployment Among Ages 45 to 54 years |
| Trinidadians and Tobagonians | 0.0 /100 | #292 | Tragic 5.2% |
| Immigrants | Senegal | 0.0 /100 | #293 | Tragic 5.2% |
| Belizeans | 0.0 /100 | #294 | Tragic 5.2% |
| Jamaicans | 0.0 /100 | #295 | Tragic 5.3% |
| Aleuts | 0.0 /100 | #296 | Tragic 5.3% |
| West Indians | 0.0 /100 | #297 | Tragic 5.3% |
| Immigrants | Trinidad and Tobago | 0.0 /100 | #298 | Tragic 5.3% |
| Ecuadorians | 0.0 /100 | #299 | Tragic 5.3% |
| Central American Indians | 0.0 /100 | #300 | Tragic 5.3% |
| Menominee | 0.0 /100 | #301 | Tragic 5.3% |
| Immigrants | Ecuador | 0.0 /100 | #302 | Tragic 5.3% |
| Immigrants | Belize | 0.0 /100 | #303 | Tragic 5.3% |
| Immigrants | Jamaica | 0.0 /100 | #304 | Tragic 5.4% |
| Immigrants | West Indies | 0.0 /100 | #305 | Tragic 5.4% |
| Immigrants | Bangladesh | 0.0 /100 | #306 | Tragic 5.4% |