Immigrants from Netherlands vs Immigrants from Albania Unemployment Among Women with Children Under 6 years
COMPARE
Immigrants from Netherlands
Immigrants from Albania
Unemployment Among Women with Children Under 6 years
Unemployment Among Women with Children Under 6 years Comparison
Immigrants from Netherlands
Immigrants from Albania
7.0%
UNEMPLOYMENT AMONG WOMEN WITH CHILDREN UNDER 6 YEARS
99.5/ 100
METRIC RATING
67th/ 347
METRIC RANK
7.1%
UNEMPLOYMENT AMONG WOMEN WITH CHILDREN UNDER 6 YEARS
98.7/ 100
METRIC RATING
84th/ 347
METRIC RANK
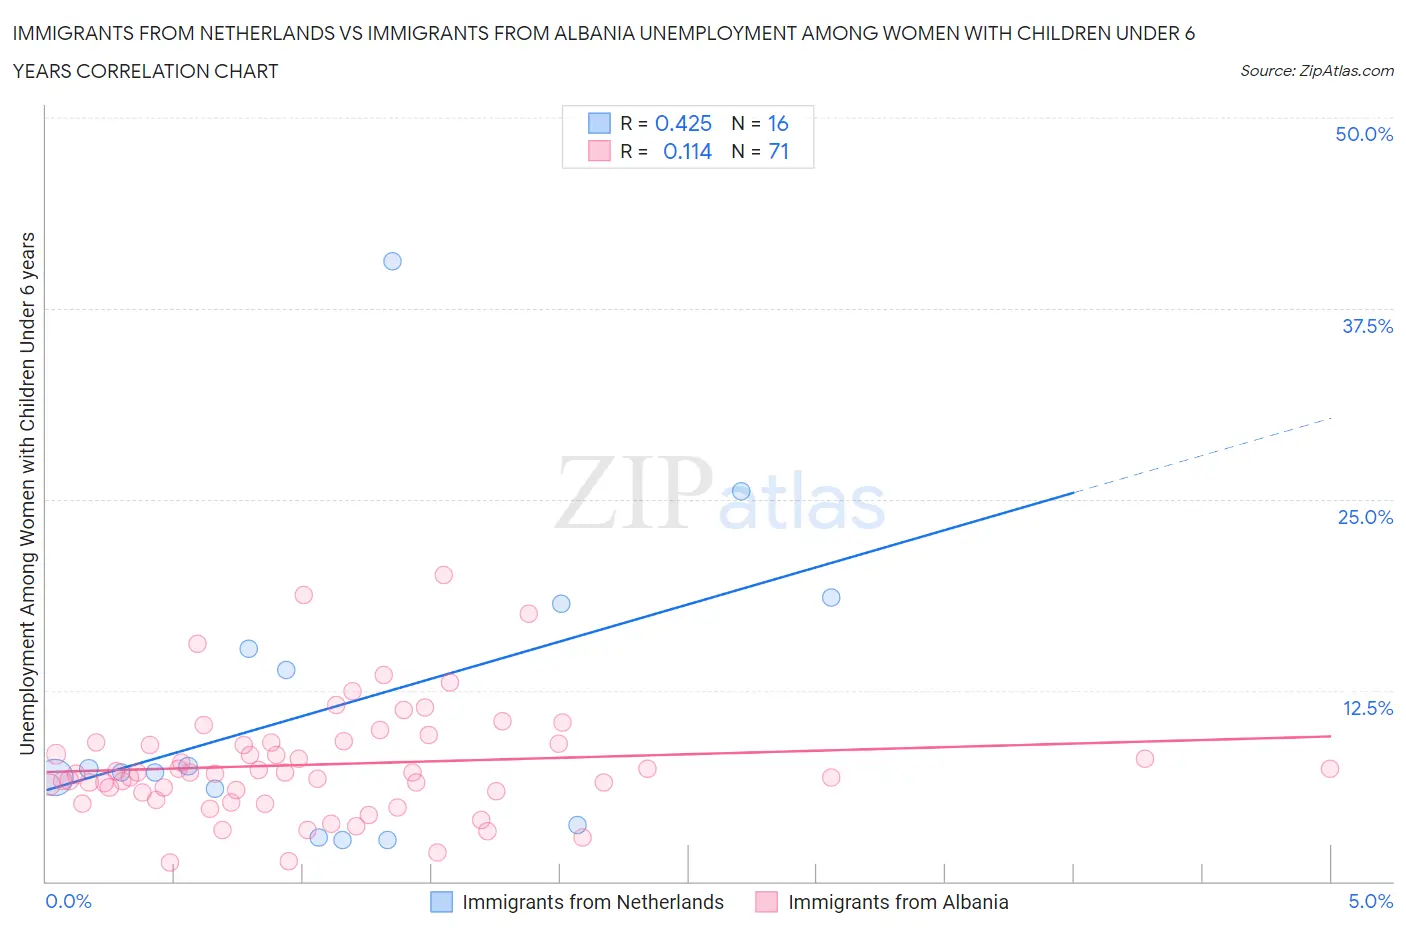
Immigrants from Netherlands vs Immigrants from Albania Unemployment Among Women with Children Under 6 years Correlation Chart
The statistical analysis conducted on geographies consisting of 192,009,733 people shows a moderate positive correlation between the proportion of Immigrants from Netherlands and unemployment rate among women with children under the age of 6 in the United States with a correlation coefficient (R) of 0.425 and weighted average of 7.0%. Similarly, the statistical analysis conducted on geographies consisting of 102,982,733 people shows a poor positive correlation between the proportion of Immigrants from Albania and unemployment rate among women with children under the age of 6 in the United States with a correlation coefficient (R) of 0.114 and weighted average of 7.1%, a difference of 1.8%.
Unemployment Among Women with Children Under 6 years Correlation Summary
| Measurement | Immigrants from Netherlands | Immigrants from Albania |
| Minimum | 2.7% | 1.2% |
| Maximum | 40.6% | 20.1% |
| Range | 37.9% | 18.8% |
| Mean | 11.6% | 7.7% |
| Median | 7.2% | 7.1% |
| Interquartile 25% (IQ1) | 4.9% | 5.8% |
| Interquartile 75% (IQ3) | 16.7% | 9.1% |
| Interquartile Range (IQR) | 11.8% | 3.2% |
| Standard Deviation (Sample) | 10.2% | 3.6% |
| Standard Deviation (Population) | 9.9% | 3.6% |
Demographics Similar to Immigrants from Netherlands and Immigrants from Albania by Unemployment Among Women with Children Under 6 years
In terms of unemployment among women with children under 6 years, the demographic groups most similar to Immigrants from Netherlands are Paraguayan (7.0%, a difference of 0.22%), Immigrants from Eritrea (7.0%, a difference of 0.26%), Immigrants from Iraq (7.0%, a difference of 0.27%), Afghan (7.0%, a difference of 0.30%), and Cuban (7.0%, a difference of 0.40%). Similarly, the demographic groups most similar to Immigrants from Albania are Immigrants from Romania (7.1%, a difference of 0.040%), Egyptian (7.1%, a difference of 0.050%), Immigrants from Afghanistan (7.1%, a difference of 0.080%), Immigrants from Venezuela (7.1%, a difference of 0.23%), and Immigrants from Greece (7.1%, a difference of 0.27%).
| Demographics | Rating | Rank | Unemployment Among Women with Children Under 6 years |
| Immigrants | Kuwait | 99.7 /100 | #65 | Exceptional 6.9% |
| Immigrants | Belgium | 99.6 /100 | #66 | Exceptional 6.9% |
| Immigrants | Netherlands | 99.5 /100 | #67 | Exceptional 7.0% |
| Paraguayans | 99.4 /100 | #68 | Exceptional 7.0% |
| Immigrants | Eritrea | 99.4 /100 | #69 | Exceptional 7.0% |
| Immigrants | Iraq | 99.4 /100 | #70 | Exceptional 7.0% |
| Afghans | 99.4 /100 | #71 | Exceptional 7.0% |
| Cubans | 99.4 /100 | #72 | Exceptional 7.0% |
| Immigrants | Czechoslovakia | 99.2 /100 | #73 | Exceptional 7.0% |
| Turks | 99.2 /100 | #74 | Exceptional 7.0% |
| Immigrants | Eastern Europe | 99.0 /100 | #75 | Exceptional 7.1% |
| Estonians | 99.0 /100 | #76 | Exceptional 7.1% |
| Immigrants | Croatia | 98.9 /100 | #77 | Exceptional 7.1% |
| Immigrants | Somalia | 98.9 /100 | #78 | Exceptional 7.1% |
| Immigrants | Fiji | 98.9 /100 | #79 | Exceptional 7.1% |
| Immigrants | Greece | 98.9 /100 | #80 | Exceptional 7.1% |
| Immigrants | Venezuela | 98.8 /100 | #81 | Exceptional 7.1% |
| Immigrants | Afghanistan | 98.7 /100 | #82 | Exceptional 7.1% |
| Egyptians | 98.7 /100 | #83 | Exceptional 7.1% |
| Immigrants | Albania | 98.7 /100 | #84 | Exceptional 7.1% |
| Immigrants | Romania | 98.7 /100 | #85 | Exceptional 7.1% |