Immigrants from Netherlands vs Basque Unemployment Among Women with Children Under 6 years
COMPARE
Immigrants from Netherlands
Basque
Unemployment Among Women with Children Under 6 years
Unemployment Among Women with Children Under 6 years Comparison
Immigrants from Netherlands
Basques
7.0%
UNEMPLOYMENT AMONG WOMEN WITH CHILDREN UNDER 6 YEARS
99.5/ 100
METRIC RATING
67th/ 347
METRIC RANK
7.8%
UNEMPLOYMENT AMONG WOMEN WITH CHILDREN UNDER 6 YEARS
24.7/ 100
METRIC RATING
201st/ 347
METRIC RANK
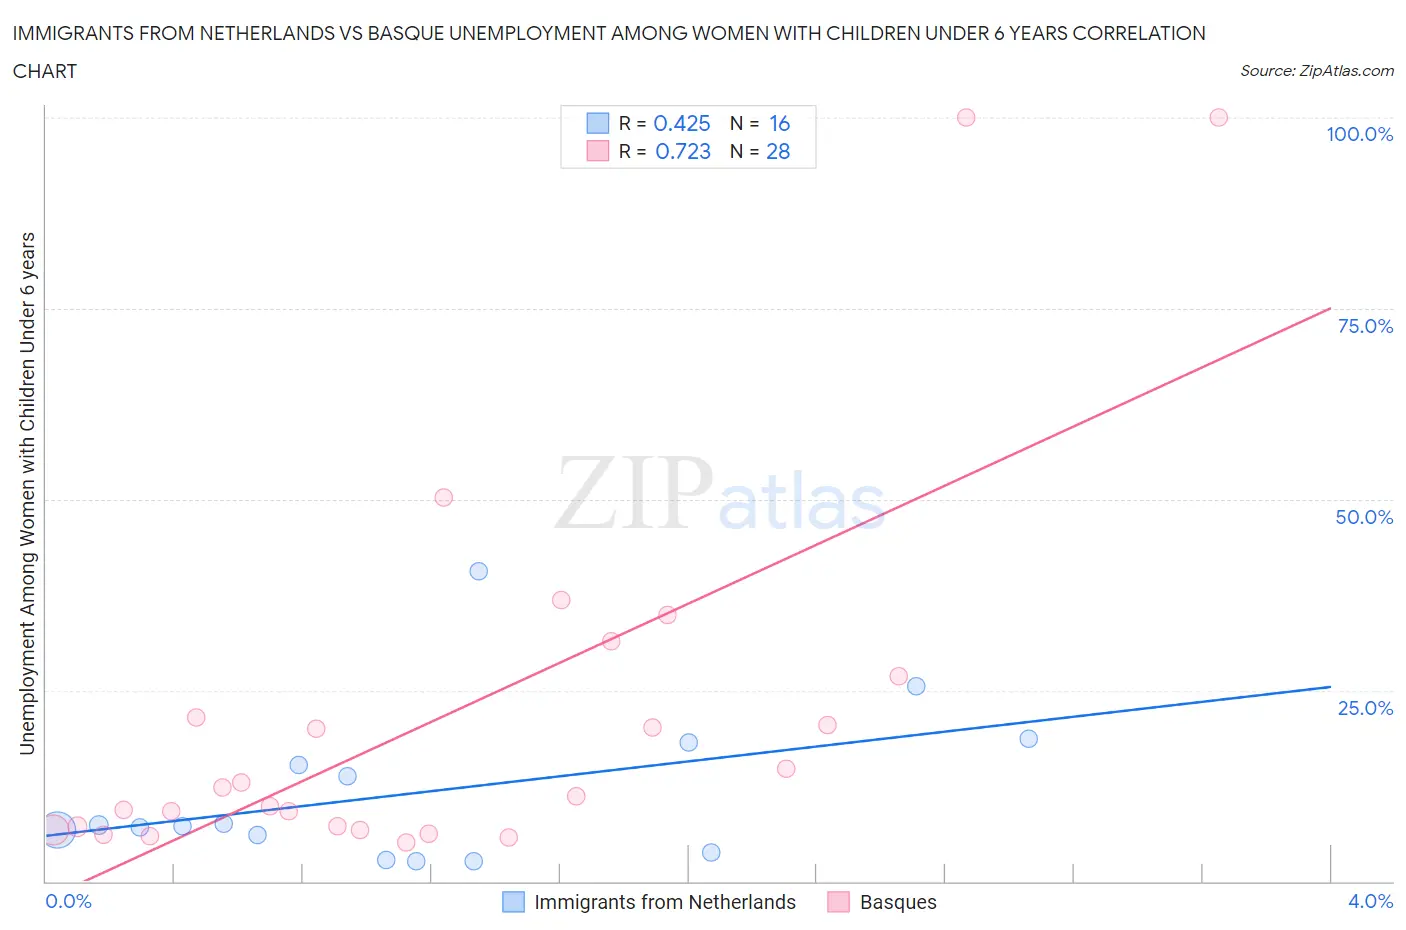
Immigrants from Netherlands vs Basque Unemployment Among Women with Children Under 6 years Correlation Chart
The statistical analysis conducted on geographies consisting of 192,009,733 people shows a moderate positive correlation between the proportion of Immigrants from Netherlands and unemployment rate among women with children under the age of 6 in the United States with a correlation coefficient (R) of 0.425 and weighted average of 7.0%. Similarly, the statistical analysis conducted on geographies consisting of 142,270,112 people shows a strong positive correlation between the proportion of Basques and unemployment rate among women with children under the age of 6 in the United States with a correlation coefficient (R) of 0.723 and weighted average of 7.8%, a difference of 11.7%.
Unemployment Among Women with Children Under 6 years Correlation Summary
| Measurement | Immigrants from Netherlands | Basque |
| Minimum | 2.7% | 5.1% |
| Maximum | 40.6% | 100.0% |
| Range | 37.9% | 94.9% |
| Mean | 11.6% | 21.7% |
| Median | 7.2% | 11.7% |
| Interquartile 25% (IQ1) | 4.9% | 6.9% |
| Interquartile 75% (IQ3) | 16.7% | 24.2% |
| Interquartile Range (IQR) | 11.8% | 17.2% |
| Standard Deviation (Sample) | 10.2% | 24.9% |
| Standard Deviation (Population) | 9.9% | 24.4% |
Similar Demographics by Unemployment Among Women with Children Under 6 years
Demographics Similar to Immigrants from Netherlands by Unemployment Among Women with Children Under 6 years
In terms of unemployment among women with children under 6 years, the demographic groups most similar to Immigrants from Netherlands are Paraguayan (7.0%, a difference of 0.22%), Immigrants from Eritrea (7.0%, a difference of 0.26%), Immigrants from Iraq (7.0%, a difference of 0.27%), Afghan (7.0%, a difference of 0.30%), and Cuban (7.0%, a difference of 0.40%).
| Demographics | Rating | Rank | Unemployment Among Women with Children Under 6 years |
| Immigrants | Sri Lanka | 99.8 /100 | #60 | Exceptional 6.9% |
| Immigrants | France | 99.7 /100 | #61 | Exceptional 6.9% |
| Somalis | 99.7 /100 | #62 | Exceptional 6.9% |
| Maltese | 99.7 /100 | #63 | Exceptional 6.9% |
| Tongans | 99.7 /100 | #64 | Exceptional 6.9% |
| Immigrants | Kuwait | 99.7 /100 | #65 | Exceptional 6.9% |
| Immigrants | Belgium | 99.6 /100 | #66 | Exceptional 6.9% |
| Immigrants | Netherlands | 99.5 /100 | #67 | Exceptional 7.0% |
| Paraguayans | 99.4 /100 | #68 | Exceptional 7.0% |
| Immigrants | Eritrea | 99.4 /100 | #69 | Exceptional 7.0% |
| Immigrants | Iraq | 99.4 /100 | #70 | Exceptional 7.0% |
| Afghans | 99.4 /100 | #71 | Exceptional 7.0% |
| Cubans | 99.4 /100 | #72 | Exceptional 7.0% |
| Immigrants | Czechoslovakia | 99.2 /100 | #73 | Exceptional 7.0% |
| Turks | 99.2 /100 | #74 | Exceptional 7.0% |
Demographics Similar to Basques by Unemployment Among Women with Children Under 6 years
In terms of unemployment among women with children under 6 years, the demographic groups most similar to Basques are Guamanian/Chamorro (7.8%, a difference of 0.070%), Sudanese (7.8%, a difference of 0.11%), Spaniard (7.8%, a difference of 0.12%), Immigrants from Poland (7.8%, a difference of 0.22%), and Lebanese (7.8%, a difference of 0.23%).
| Demographics | Rating | Rank | Unemployment Among Women with Children Under 6 years |
| Syrians | 31.9 /100 | #194 | Fair 7.7% |
| Malaysians | 31.1 /100 | #195 | Fair 7.7% |
| Immigrants | St. Vincent and the Grenadines | 31.1 /100 | #196 | Fair 7.7% |
| Italians | 30.4 /100 | #197 | Fair 7.7% |
| Lithuanians | 30.0 /100 | #198 | Fair 7.8% |
| Immigrants | Poland | 27.3 /100 | #199 | Fair 7.8% |
| Guamanians/Chamorros | 25.5 /100 | #200 | Fair 7.8% |
| Basques | 24.7 /100 | #201 | Fair 7.8% |
| Sudanese | 23.5 /100 | #202 | Fair 7.8% |
| Spaniards | 23.3 /100 | #203 | Fair 7.8% |
| Lebanese | 22.2 /100 | #204 | Fair 7.8% |
| Immigrants | Immigrants | 21.4 /100 | #205 | Fair 7.8% |
| Hungarians | 21.2 /100 | #206 | Fair 7.8% |
| Canadians | 20.6 /100 | #207 | Fair 7.8% |
| Immigrants | Syria | 18.9 /100 | #208 | Poor 7.8% |