Immigrants from Nicaragua vs Immigrants from Albania Unemployment Among Women with Children Under 6 years
COMPARE
Immigrants from Nicaragua
Immigrants from Albania
Unemployment Among Women with Children Under 6 years
Unemployment Among Women with Children Under 6 years Comparison
Immigrants from Nicaragua
Immigrants from Albania
7.2%
UNEMPLOYMENT AMONG WOMEN WITH CHILDREN UNDER 6 YEARS
97.3/ 100
METRIC RATING
102nd/ 347
METRIC RANK
7.1%
UNEMPLOYMENT AMONG WOMEN WITH CHILDREN UNDER 6 YEARS
98.7/ 100
METRIC RATING
84th/ 347
METRIC RANK
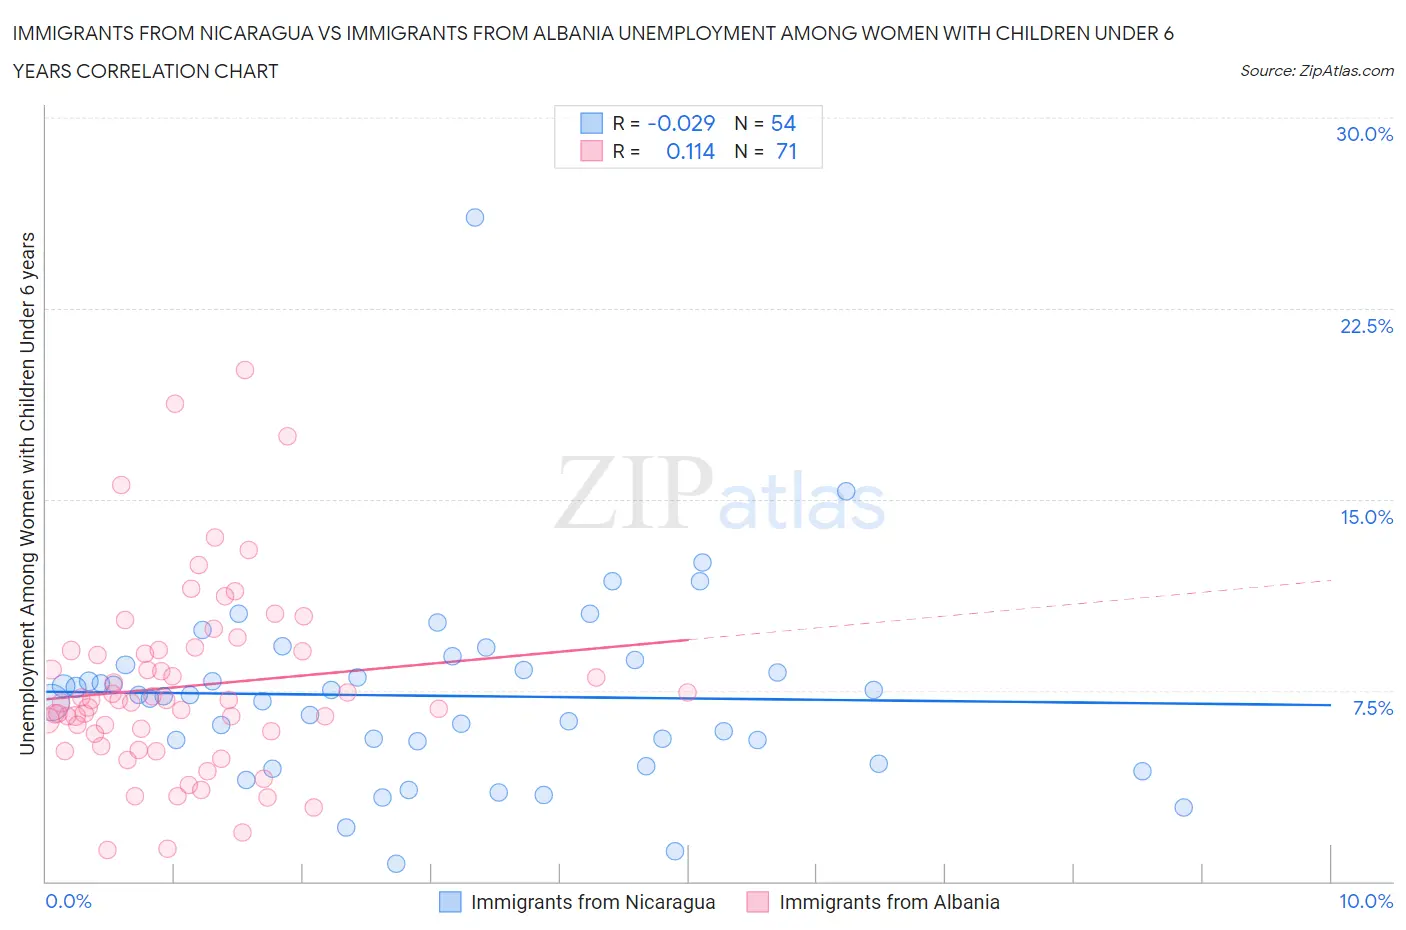
Immigrants from Nicaragua vs Immigrants from Albania Unemployment Among Women with Children Under 6 years Correlation Chart
The statistical analysis conducted on geographies consisting of 200,218,273 people shows no correlation between the proportion of Immigrants from Nicaragua and unemployment rate among women with children under the age of 6 in the United States with a correlation coefficient (R) of -0.029 and weighted average of 7.2%. Similarly, the statistical analysis conducted on geographies consisting of 102,982,733 people shows a poor positive correlation between the proportion of Immigrants from Albania and unemployment rate among women with children under the age of 6 in the United States with a correlation coefficient (R) of 0.114 and weighted average of 7.1%, a difference of 1.3%.
Unemployment Among Women with Children Under 6 years Correlation Summary
| Measurement | Immigrants from Nicaragua | Immigrants from Albania |
| Minimum | 0.70% | 1.2% |
| Maximum | 26.1% | 20.1% |
| Range | 25.4% | 18.8% |
| Mean | 7.3% | 7.7% |
| Median | 7.3% | 7.1% |
| Interquartile 25% (IQ1) | 5.5% | 5.8% |
| Interquartile 75% (IQ3) | 8.5% | 9.1% |
| Interquartile Range (IQR) | 3.0% | 3.2% |
| Standard Deviation (Sample) | 3.9% | 3.6% |
| Standard Deviation (Population) | 3.8% | 3.6% |
Demographics Similar to Immigrants from Nicaragua and Immigrants from Albania by Unemployment Among Women with Children Under 6 years
In terms of unemployment among women with children under 6 years, the demographic groups most similar to Immigrants from Nicaragua are Immigrants from Saudi Arabia (7.2%, a difference of 0.0%), Chilean (7.2%, a difference of 0.030%), Immigrants from Northern Europe (7.2%, a difference of 0.050%), Immigrants from Europe (7.2%, a difference of 0.10%), and Russian (7.2%, a difference of 0.13%). Similarly, the demographic groups most similar to Immigrants from Albania are Immigrants from Romania (7.1%, a difference of 0.040%), Egyptian (7.1%, a difference of 0.050%), Immigrants from Zimbabwe (7.1%, a difference of 0.16%), Alsatian (7.1%, a difference of 0.32%), and Immigrants from Hungary (7.1%, a difference of 0.44%).
| Demographics | Rating | Rank | Unemployment Among Women with Children Under 6 years |
| Egyptians | 98.7 /100 | #83 | Exceptional 7.1% |
| Immigrants | Albania | 98.7 /100 | #84 | Exceptional 7.1% |
| Immigrants | Romania | 98.7 /100 | #85 | Exceptional 7.1% |
| Immigrants | Zimbabwe | 98.6 /100 | #86 | Exceptional 7.1% |
| Alsatians | 98.4 /100 | #87 | Exceptional 7.1% |
| Immigrants | Hungary | 98.3 /100 | #88 | Exceptional 7.1% |
| Immigrants | Denmark | 98.3 /100 | #89 | Exceptional 7.1% |
| Immigrants | Spain | 98.2 /100 | #90 | Exceptional 7.1% |
| Danes | 98.2 /100 | #91 | Exceptional 7.1% |
| Albanians | 98.0 /100 | #92 | Exceptional 7.2% |
| New Zealanders | 97.8 /100 | #93 | Exceptional 7.2% |
| Macedonians | 97.7 /100 | #94 | Exceptional 7.2% |
| Romanians | 97.7 /100 | #95 | Exceptional 7.2% |
| Immigrants | Eastern Africa | 97.7 /100 | #96 | Exceptional 7.2% |
| Immigrants | South Eastern Asia | 97.6 /100 | #97 | Exceptional 7.2% |
| Russians | 97.5 /100 | #98 | Exceptional 7.2% |
| Immigrants | Europe | 97.5 /100 | #99 | Exceptional 7.2% |
| Immigrants | Northern Europe | 97.4 /100 | #100 | Exceptional 7.2% |
| Chileans | 97.4 /100 | #101 | Exceptional 7.2% |
| Immigrants | Nicaragua | 97.3 /100 | #102 | Exceptional 7.2% |
| Immigrants | Saudi Arabia | 97.3 /100 | #103 | Exceptional 7.2% |