Immigrants from Moldova vs Comanche Unemployment Among Ages 65 to 74 years
COMPARE
Immigrants from Moldova
Comanche
Unemployment Among Ages 65 to 74 years
Unemployment Among Ages 65 to 74 years Comparison
Immigrants from Moldova
Comanche
5.1%
UNEMPLOYMENT AMONG AGES 65 TO 74 YEARS
99.3/ 100
METRIC RATING
64th/ 347
METRIC RANK
4.7%
UNEMPLOYMENT AMONG AGES 65 TO 74 YEARS
100.0/ 100
METRIC RATING
8th/ 347
METRIC RANK
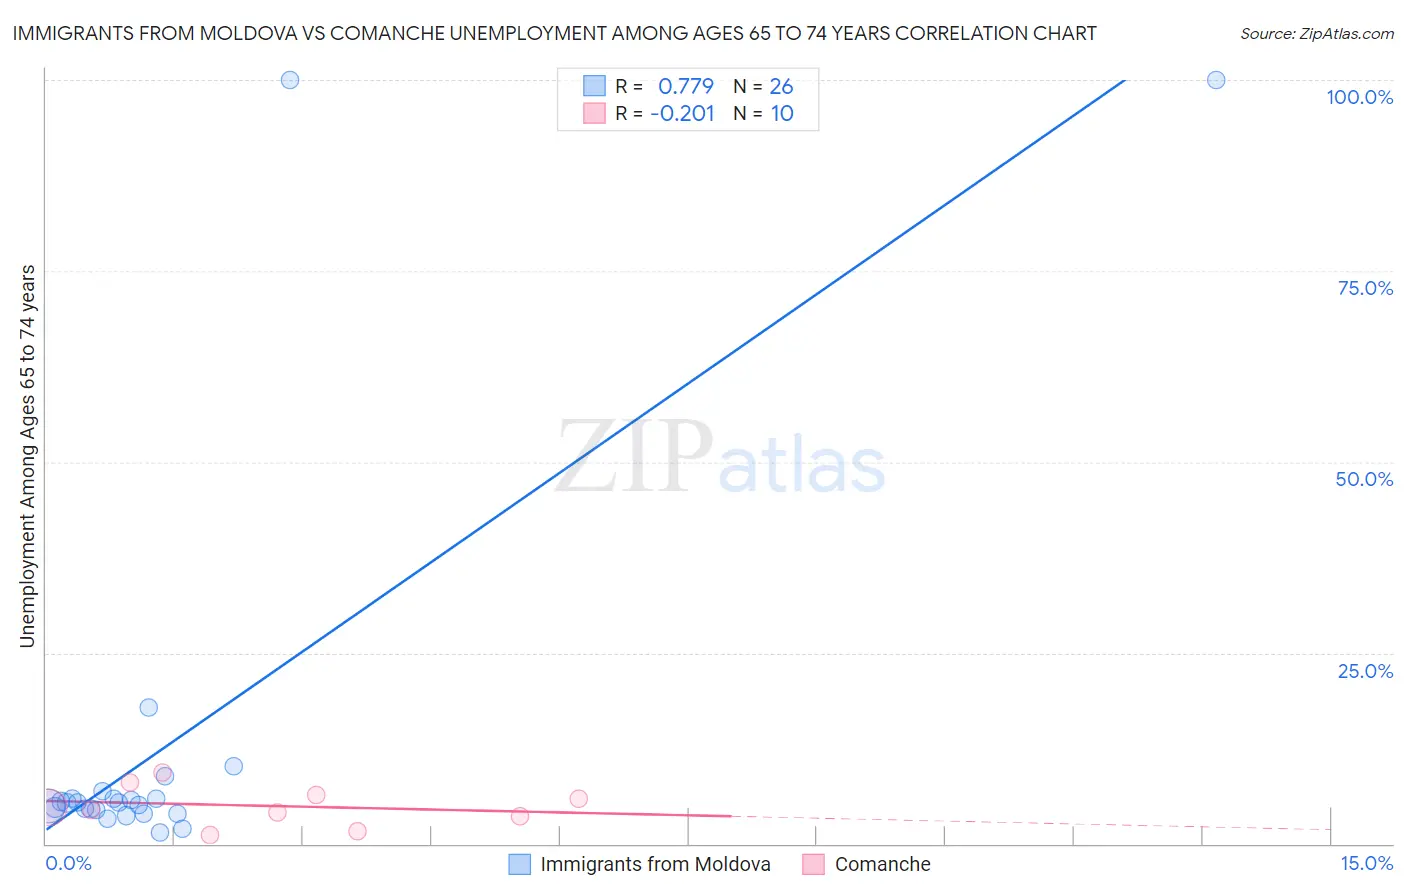
Immigrants from Moldova vs Comanche Unemployment Among Ages 65 to 74 years Correlation Chart
The statistical analysis conducted on geographies consisting of 118,489,415 people shows a strong positive correlation between the proportion of Immigrants from Moldova and unemployment rate among population between the ages 65 and 74 in the United States with a correlation coefficient (R) of 0.779 and weighted average of 5.1%. Similarly, the statistical analysis conducted on geographies consisting of 102,476,327 people shows a weak negative correlation between the proportion of Comanche and unemployment rate among population between the ages 65 and 74 in the United States with a correlation coefficient (R) of -0.201 and weighted average of 4.7%, a difference of 9.5%.
Unemployment Among Ages 65 to 74 years Correlation Summary
| Measurement | Immigrants from Moldova | Comanche |
| Minimum | 1.5% | 1.2% |
| Maximum | 100.0% | 9.4% |
| Range | 98.5% | 8.2% |
| Mean | 12.9% | 5.0% |
| Median | 5.4% | 4.6% |
| Interquartile 25% (IQ1) | 4.4% | 3.6% |
| Interquartile 75% (IQ3) | 5.9% | 6.4% |
| Interquartile Range (IQR) | 1.5% | 2.8% |
| Standard Deviation (Sample) | 25.8% | 2.6% |
| Standard Deviation (Population) | 25.3% | 2.5% |
Similar Demographics by Unemployment Among Ages 65 to 74 years
Demographics Similar to Immigrants from Moldova by Unemployment Among Ages 65 to 74 years
In terms of unemployment among ages 65 to 74 years, the demographic groups most similar to Immigrants from Moldova are Bolivian (5.1%, a difference of 0.0%), Iroquois (5.1%, a difference of 0.040%), Kiowa (5.1%, a difference of 0.050%), Nicaraguan (5.1%, a difference of 0.090%), and Swiss (5.1%, a difference of 0.090%).
| Demographics | Rating | Rank | Unemployment Among Ages 65 to 74 years |
| Croatians | 99.5 /100 | #57 | Exceptional 5.1% |
| Germans | 99.5 /100 | #58 | Exceptional 5.1% |
| Immigrants | Bulgaria | 99.4 /100 | #59 | Exceptional 5.1% |
| Immigrants | Jordan | 99.4 /100 | #60 | Exceptional 5.1% |
| Immigrants | Taiwan | 99.4 /100 | #61 | Exceptional 5.1% |
| Nicaraguans | 99.4 /100 | #62 | Exceptional 5.1% |
| Kiowa | 99.3 /100 | #63 | Exceptional 5.1% |
| Immigrants | Moldova | 99.3 /100 | #64 | Exceptional 5.1% |
| Bolivians | 99.3 /100 | #65 | Exceptional 5.1% |
| Iroquois | 99.3 /100 | #66 | Exceptional 5.1% |
| Swiss | 99.2 /100 | #67 | Exceptional 5.1% |
| Latvians | 99.2 /100 | #68 | Exceptional 5.1% |
| Scandinavians | 99.1 /100 | #69 | Exceptional 5.2% |
| Immigrants | Japan | 99.1 /100 | #70 | Exceptional 5.2% |
| Scotch-Irish | 99.0 /100 | #71 | Exceptional 5.2% |
Demographics Similar to Comanche by Unemployment Among Ages 65 to 74 years
In terms of unemployment among ages 65 to 74 years, the demographic groups most similar to Comanche are Indonesian (4.7%, a difference of 0.17%), Chickasaw (4.7%, a difference of 0.26%), Osage (4.7%, a difference of 0.37%), Immigrants from Congo (4.7%, a difference of 0.78%), and Tongan (4.7%, a difference of 0.95%).
| Demographics | Rating | Rank | Unemployment Among Ages 65 to 74 years |
| Hmong | 100.0 /100 | #1 | Exceptional 4.2% |
| Chinese | 100.0 /100 | #2 | Exceptional 4.4% |
| Fijians | 100.0 /100 | #3 | Exceptional 4.5% |
| Tsimshian | 100.0 /100 | #4 | Exceptional 4.6% |
| Sudanese | 100.0 /100 | #5 | Exceptional 4.6% |
| Immigrants | Cuba | 100.0 /100 | #6 | Exceptional 4.6% |
| Indonesians | 100.0 /100 | #7 | Exceptional 4.7% |
| Comanche | 100.0 /100 | #8 | Exceptional 4.7% |
| Chickasaw | 100.0 /100 | #9 | Exceptional 4.7% |
| Osage | 100.0 /100 | #10 | Exceptional 4.7% |
| Immigrants | Congo | 100.0 /100 | #11 | Exceptional 4.7% |
| Tongans | 100.0 /100 | #12 | Exceptional 4.7% |
| Lumbee | 100.0 /100 | #13 | Exceptional 4.8% |
| Cubans | 100.0 /100 | #14 | Exceptional 4.8% |
| Immigrants | North Macedonia | 100.0 /100 | #15 | Exceptional 4.8% |