Immigrants from Greece vs Comanche Unemployment Among Ages 65 to 74 years
COMPARE
Immigrants from Greece
Comanche
Unemployment Among Ages 65 to 74 years
Unemployment Among Ages 65 to 74 years Comparison
Immigrants from Greece
Comanche
5.6%
UNEMPLOYMENT AMONG AGES 65 TO 74 YEARS
0.9/ 100
METRIC RATING
245th/ 347
METRIC RANK
4.7%
UNEMPLOYMENT AMONG AGES 65 TO 74 YEARS
100.0/ 100
METRIC RATING
8th/ 347
METRIC RANK
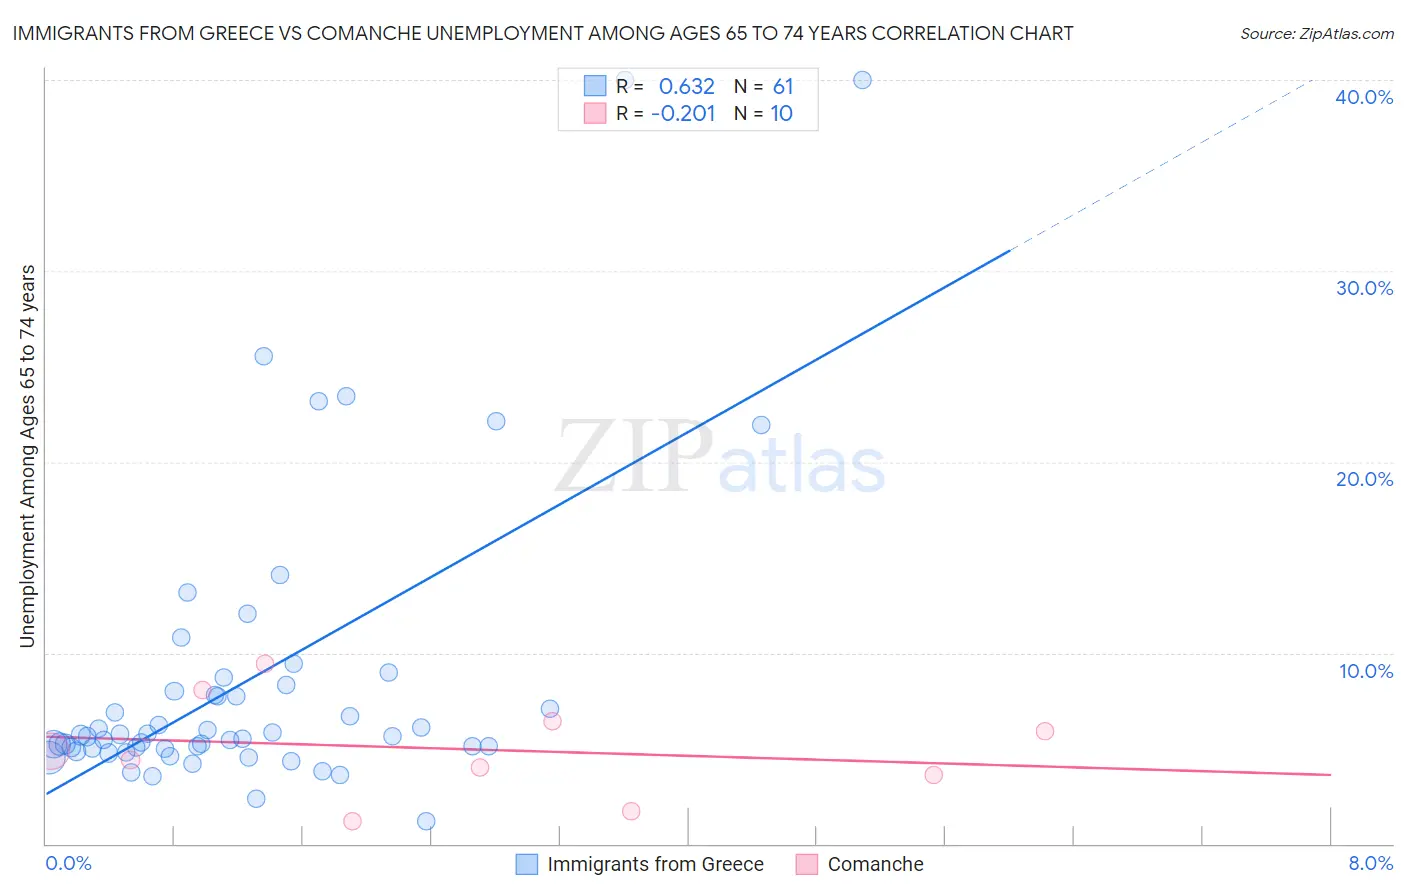
Immigrants from Greece vs Comanche Unemployment Among Ages 65 to 74 years Correlation Chart
The statistical analysis conducted on geographies consisting of 203,377,049 people shows a significant positive correlation between the proportion of Immigrants from Greece and unemployment rate among population between the ages 65 and 74 in the United States with a correlation coefficient (R) of 0.632 and weighted average of 5.6%. Similarly, the statistical analysis conducted on geographies consisting of 102,476,327 people shows a weak negative correlation between the proportion of Comanche and unemployment rate among population between the ages 65 and 74 in the United States with a correlation coefficient (R) of -0.201 and weighted average of 4.7%, a difference of 18.6%.
Unemployment Among Ages 65 to 74 years Correlation Summary
| Measurement | Immigrants from Greece | Comanche |
| Minimum | 1.2% | 1.2% |
| Maximum | 40.0% | 9.4% |
| Range | 38.8% | 8.2% |
| Mean | 8.6% | 5.0% |
| Median | 5.6% | 4.6% |
| Interquartile 25% (IQ1) | 5.0% | 3.6% |
| Interquartile 75% (IQ3) | 8.1% | 6.4% |
| Interquartile Range (IQR) | 3.1% | 2.8% |
| Standard Deviation (Sample) | 7.9% | 2.6% |
| Standard Deviation (Population) | 7.8% | 2.5% |
Similar Demographics by Unemployment Among Ages 65 to 74 years
Demographics Similar to Immigrants from Greece by Unemployment Among Ages 65 to 74 years
In terms of unemployment among ages 65 to 74 years, the demographic groups most similar to Immigrants from Greece are Immigrants from Micronesia (5.6%, a difference of 0.0%), Paraguayan (5.6%, a difference of 0.010%), Immigrants (5.6%, a difference of 0.060%), Immigrants from Argentina (5.6%, a difference of 0.060%), and Trinidadian and Tobagonian (5.6%, a difference of 0.12%).
| Demographics | Rating | Rank | Unemployment Among Ages 65 to 74 years |
| Cajuns | 1.8 /100 | #238 | Tragic 5.5% |
| German Russians | 1.6 /100 | #239 | Tragic 5.5% |
| Ghanaians | 1.4 /100 | #240 | Tragic 5.6% |
| Cree | 1.4 /100 | #241 | Tragic 5.6% |
| Immigrants | Ghana | 1.4 /100 | #242 | Tragic 5.6% |
| Immigrants | Peru | 1.3 /100 | #243 | Tragic 5.6% |
| Immigrants | Micronesia | 0.9 /100 | #244 | Tragic 5.6% |
| Immigrants | Greece | 0.9 /100 | #245 | Tragic 5.6% |
| Paraguayans | 0.9 /100 | #246 | Tragic 5.6% |
| Immigrants | Immigrants | 0.9 /100 | #247 | Tragic 5.6% |
| Immigrants | Argentina | 0.9 /100 | #248 | Tragic 5.6% |
| Trinidadians and Tobagonians | 0.8 /100 | #249 | Tragic 5.6% |
| Cape Verdeans | 0.7 /100 | #250 | Tragic 5.6% |
| Brazilians | 0.5 /100 | #251 | Tragic 5.6% |
| Colombians | 0.5 /100 | #252 | Tragic 5.6% |
Demographics Similar to Comanche by Unemployment Among Ages 65 to 74 years
In terms of unemployment among ages 65 to 74 years, the demographic groups most similar to Comanche are Indonesian (4.7%, a difference of 0.17%), Chickasaw (4.7%, a difference of 0.26%), Osage (4.7%, a difference of 0.37%), Immigrants from Congo (4.7%, a difference of 0.78%), and Tongan (4.7%, a difference of 0.95%).
| Demographics | Rating | Rank | Unemployment Among Ages 65 to 74 years |
| Hmong | 100.0 /100 | #1 | Exceptional 4.2% |
| Chinese | 100.0 /100 | #2 | Exceptional 4.4% |
| Fijians | 100.0 /100 | #3 | Exceptional 4.5% |
| Tsimshian | 100.0 /100 | #4 | Exceptional 4.6% |
| Sudanese | 100.0 /100 | #5 | Exceptional 4.6% |
| Immigrants | Cuba | 100.0 /100 | #6 | Exceptional 4.6% |
| Indonesians | 100.0 /100 | #7 | Exceptional 4.7% |
| Comanche | 100.0 /100 | #8 | Exceptional 4.7% |
| Chickasaw | 100.0 /100 | #9 | Exceptional 4.7% |
| Osage | 100.0 /100 | #10 | Exceptional 4.7% |
| Immigrants | Congo | 100.0 /100 | #11 | Exceptional 4.7% |
| Tongans | 100.0 /100 | #12 | Exceptional 4.7% |
| Lumbee | 100.0 /100 | #13 | Exceptional 4.8% |
| Cubans | 100.0 /100 | #14 | Exceptional 4.8% |
| Immigrants | North Macedonia | 100.0 /100 | #15 | Exceptional 4.8% |