Immigrants from Moldova vs South American Indian Unemployment Among Ages 65 to 74 years
COMPARE
Immigrants from Moldova
South American Indian
Unemployment Among Ages 65 to 74 years
Unemployment Among Ages 65 to 74 years Comparison
Immigrants from Moldova
South American Indians
5.1%
UNEMPLOYMENT AMONG AGES 65 TO 74 YEARS
99.3/ 100
METRIC RATING
64th/ 347
METRIC RANK
5.5%
UNEMPLOYMENT AMONG AGES 65 TO 74 YEARS
2.3/ 100
METRIC RATING
233rd/ 347
METRIC RANK
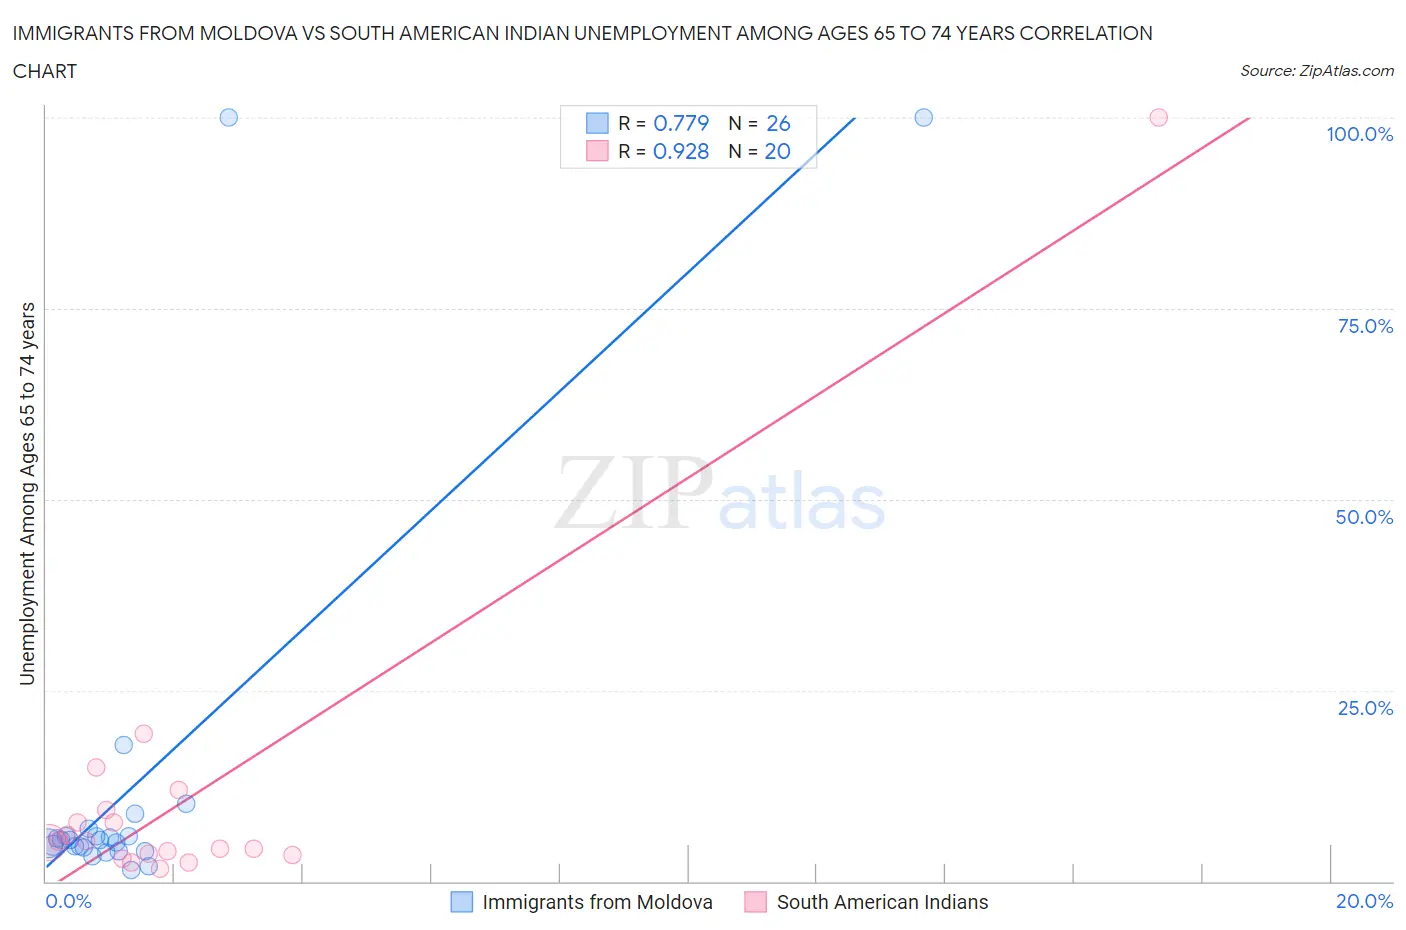
Immigrants from Moldova vs South American Indian Unemployment Among Ages 65 to 74 years Correlation Chart
The statistical analysis conducted on geographies consisting of 118,489,415 people shows a strong positive correlation between the proportion of Immigrants from Moldova and unemployment rate among population between the ages 65 and 74 in the United States with a correlation coefficient (R) of 0.779 and weighted average of 5.1%. Similarly, the statistical analysis conducted on geographies consisting of 156,397,122 people shows a near-perfect positive correlation between the proportion of South American Indians and unemployment rate among population between the ages 65 and 74 in the United States with a correlation coefficient (R) of 0.928 and weighted average of 5.5%, a difference of 7.6%.
Unemployment Among Ages 65 to 74 years Correlation Summary
| Measurement | Immigrants from Moldova | South American Indian |
| Minimum | 1.5% | 1.6% |
| Maximum | 100.0% | 100.0% |
| Range | 98.5% | 98.4% |
| Mean | 12.9% | 11.1% |
| Median | 5.4% | 5.2% |
| Interquartile 25% (IQ1) | 4.4% | 3.5% |
| Interquartile 75% (IQ3) | 5.9% | 8.6% |
| Interquartile Range (IQR) | 1.5% | 5.0% |
| Standard Deviation (Sample) | 25.8% | 21.4% |
| Standard Deviation (Population) | 25.3% | 20.9% |
Similar Demographics by Unemployment Among Ages 65 to 74 years
Demographics Similar to Immigrants from Moldova by Unemployment Among Ages 65 to 74 years
In terms of unemployment among ages 65 to 74 years, the demographic groups most similar to Immigrants from Moldova are Bolivian (5.1%, a difference of 0.0%), Iroquois (5.1%, a difference of 0.040%), Kiowa (5.1%, a difference of 0.050%), Nicaraguan (5.1%, a difference of 0.090%), and Swiss (5.1%, a difference of 0.090%).
| Demographics | Rating | Rank | Unemployment Among Ages 65 to 74 years |
| Croatians | 99.5 /100 | #57 | Exceptional 5.1% |
| Germans | 99.5 /100 | #58 | Exceptional 5.1% |
| Immigrants | Bulgaria | 99.4 /100 | #59 | Exceptional 5.1% |
| Immigrants | Jordan | 99.4 /100 | #60 | Exceptional 5.1% |
| Immigrants | Taiwan | 99.4 /100 | #61 | Exceptional 5.1% |
| Nicaraguans | 99.4 /100 | #62 | Exceptional 5.1% |
| Kiowa | 99.3 /100 | #63 | Exceptional 5.1% |
| Immigrants | Moldova | 99.3 /100 | #64 | Exceptional 5.1% |
| Bolivians | 99.3 /100 | #65 | Exceptional 5.1% |
| Iroquois | 99.3 /100 | #66 | Exceptional 5.1% |
| Swiss | 99.2 /100 | #67 | Exceptional 5.1% |
| Latvians | 99.2 /100 | #68 | Exceptional 5.1% |
| Scandinavians | 99.1 /100 | #69 | Exceptional 5.2% |
| Immigrants | Japan | 99.1 /100 | #70 | Exceptional 5.2% |
| Scotch-Irish | 99.0 /100 | #71 | Exceptional 5.2% |
Demographics Similar to South American Indians by Unemployment Among Ages 65 to 74 years
In terms of unemployment among ages 65 to 74 years, the demographic groups most similar to South American Indians are French American Indian (5.5%, a difference of 0.020%), Peruvian (5.5%, a difference of 0.020%), Hopi (5.5%, a difference of 0.030%), Immigrants from Belize (5.5%, a difference of 0.030%), and Nigerian (5.5%, a difference of 0.090%).
| Demographics | Rating | Rank | Unemployment Among Ages 65 to 74 years |
| Hondurans | 3.7 /100 | #226 | Tragic 5.5% |
| Immigrants | Albania | 3.7 /100 | #227 | Tragic 5.5% |
| Immigrants | Israel | 3.0 /100 | #228 | Tragic 5.5% |
| West Indians | 2.7 /100 | #229 | Tragic 5.5% |
| Immigrants | Caribbean | 2.7 /100 | #230 | Tragic 5.5% |
| Israelis | 2.5 /100 | #231 | Tragic 5.5% |
| Nigerians | 2.5 /100 | #232 | Tragic 5.5% |
| South American Indians | 2.3 /100 | #233 | Tragic 5.5% |
| French American Indians | 2.2 /100 | #234 | Tragic 5.5% |
| Peruvians | 2.2 /100 | #235 | Tragic 5.5% |
| Hopi | 2.2 /100 | #236 | Tragic 5.5% |
| Immigrants | Belize | 2.2 /100 | #237 | Tragic 5.5% |
| Cajuns | 1.8 /100 | #238 | Tragic 5.5% |
| German Russians | 1.6 /100 | #239 | Tragic 5.5% |
| Ghanaians | 1.4 /100 | #240 | Tragic 5.6% |