Immigrants from Belize vs West Indian Unemployment Among Women with Children Under 6 years
COMPARE
Immigrants from Belize
West Indian
Unemployment Among Women with Children Under 6 years
Unemployment Among Women with Children Under 6 years Comparison
Immigrants from Belize
West Indians
8.6%
UNEMPLOYMENT AMONG WOMEN WITH CHILDREN UNDER 6 YEARS
0.0/ 100
METRIC RATING
280th/ 347
METRIC RANK
8.4%
UNEMPLOYMENT AMONG WOMEN WITH CHILDREN UNDER 6 YEARS
0.3/ 100
METRIC RATING
262nd/ 347
METRIC RANK
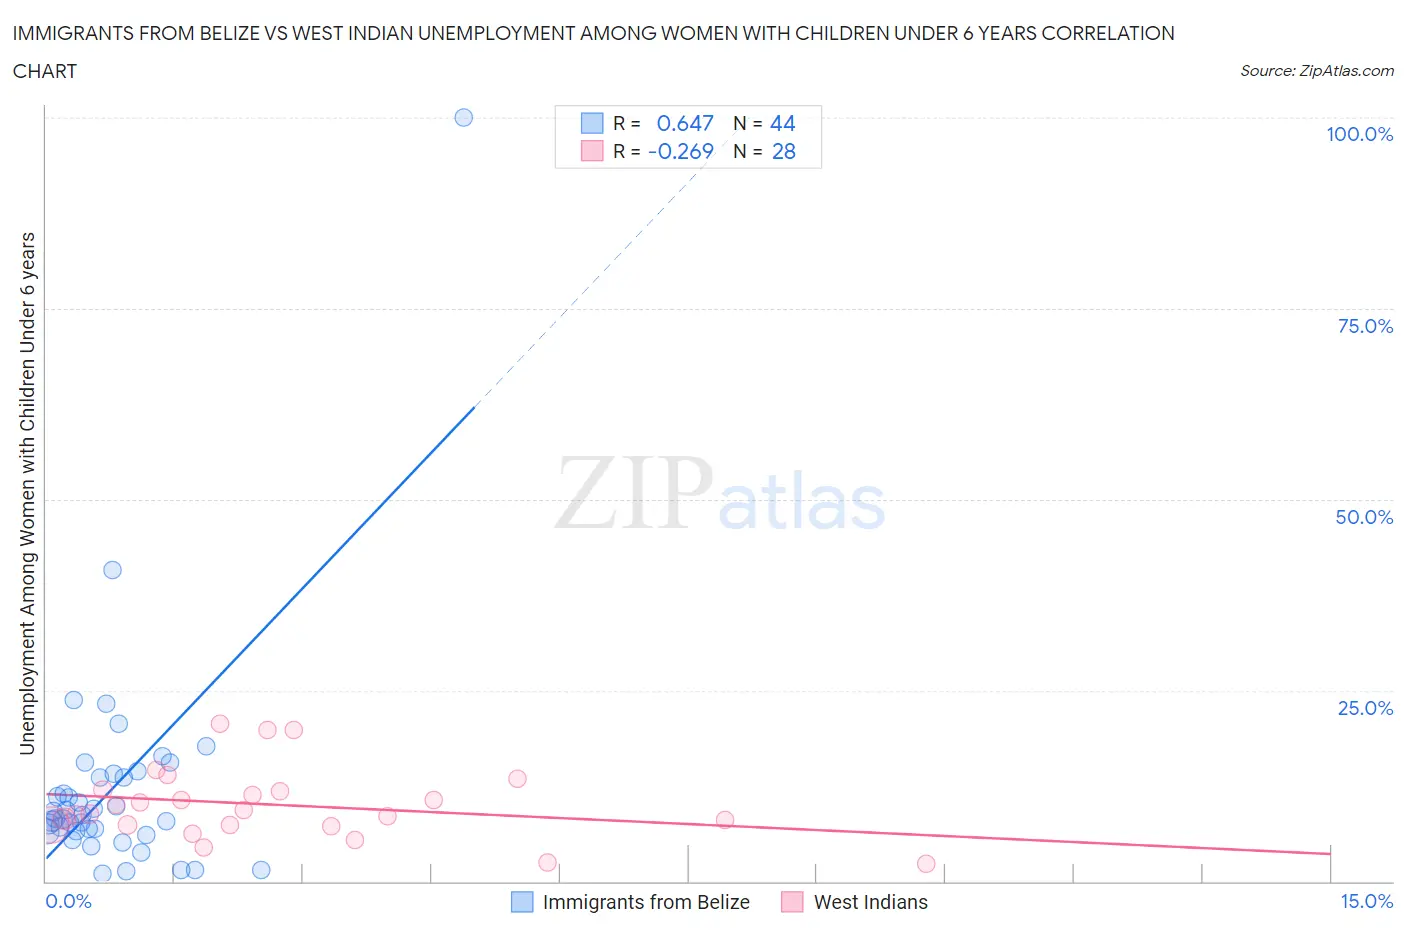
Immigrants from Belize vs West Indian Unemployment Among Women with Children Under 6 years Correlation Chart
The statistical analysis conducted on geographies consisting of 116,794,257 people shows a significant positive correlation between the proportion of Immigrants from Belize and unemployment rate among women with children under the age of 6 in the United States with a correlation coefficient (R) of 0.647 and weighted average of 8.6%. Similarly, the statistical analysis conducted on geographies consisting of 210,232,291 people shows a weak negative correlation between the proportion of West Indians and unemployment rate among women with children under the age of 6 in the United States with a correlation coefficient (R) of -0.269 and weighted average of 8.4%, a difference of 3.1%.
Unemployment Among Women with Children Under 6 years Correlation Summary
| Measurement | Immigrants from Belize | West Indian |
| Minimum | 1.0% | 2.3% |
| Maximum | 100.0% | 20.6% |
| Range | 99.0% | 18.3% |
| Mean | 12.3% | 10.0% |
| Median | 8.5% | 9.1% |
| Interquartile 25% (IQ1) | 6.6% | 7.3% |
| Interquartile 75% (IQ3) | 13.9% | 11.9% |
| Interquartile Range (IQR) | 7.3% | 4.6% |
| Standard Deviation (Sample) | 15.3% | 4.6% |
| Standard Deviation (Population) | 15.2% | 4.6% |
Demographics Similar to Immigrants from Belize and West Indians by Unemployment Among Women with Children Under 6 years
In terms of unemployment among women with children under 6 years, the demographic groups most similar to Immigrants from Belize are Immigrants from Guatemala (8.6%, a difference of 0.040%), Immigrants from Dominica (8.6%, a difference of 0.050%), Guatemalan (8.7%, a difference of 0.14%), Haitian (8.6%, a difference of 0.33%), and Yaqui (8.6%, a difference of 0.43%). Similarly, the demographic groups most similar to West Indians are Immigrants from Liberia (8.4%, a difference of 0.010%), Scotch-Irish (8.4%, a difference of 0.030%), Honduran (8.4%, a difference of 0.050%), French Canadian (8.4%, a difference of 0.10%), and Immigrants from Honduras (8.4%, a difference of 0.11%).
| Demographics | Rating | Rank | Unemployment Among Women with Children Under 6 years |
| Immigrants | Liberia | 0.3 /100 | #261 | Tragic 8.4% |
| West Indians | 0.3 /100 | #262 | Tragic 8.4% |
| Scotch-Irish | 0.3 /100 | #263 | Tragic 8.4% |
| Hondurans | 0.3 /100 | #264 | Tragic 8.4% |
| French Canadians | 0.3 /100 | #265 | Tragic 8.4% |
| Immigrants | Honduras | 0.3 /100 | #266 | Tragic 8.4% |
| Belizeans | 0.2 /100 | #267 | Tragic 8.4% |
| Sub-Saharan Africans | 0.2 /100 | #268 | Tragic 8.4% |
| Immigrants | Haiti | 0.2 /100 | #269 | Tragic 8.4% |
| Immigrants | Senegal | 0.2 /100 | #270 | Tragic 8.5% |
| Immigrants | Congo | 0.2 /100 | #271 | Tragic 8.5% |
| Mexican American Indians | 0.1 /100 | #272 | Tragic 8.5% |
| Slovaks | 0.1 /100 | #273 | Tragic 8.5% |
| Immigrants | Cameroon | 0.1 /100 | #274 | Tragic 8.6% |
| Immigrants | Latin America | 0.1 /100 | #275 | Tragic 8.6% |
| Yaqui | 0.0 /100 | #276 | Tragic 8.6% |
| Haitians | 0.0 /100 | #277 | Tragic 8.6% |
| Immigrants | Dominica | 0.0 /100 | #278 | Tragic 8.6% |
| Immigrants | Guatemala | 0.0 /100 | #279 | Tragic 8.6% |
| Immigrants | Belize | 0.0 /100 | #280 | Tragic 8.6% |
| Guatemalans | 0.0 /100 | #281 | Tragic 8.7% |