Immigrants from Kuwait vs Immigrants from Western Africa Unemployment Among Seniors over 65 years
COMPARE
Immigrants from Kuwait
Immigrants from Western Africa
Unemployment Among Seniors over 65 years
Unemployment Among Seniors over 65 years Comparison
Immigrants from Kuwait
Immigrants from Western Africa
4.8%
UNEMPLOYMENT AMONG SENIORS OVER 65 YEARS
100.0/ 100
METRIC RATING
35th/ 347
METRIC RANK
5.4%
UNEMPLOYMENT AMONG SENIORS OVER 65 YEARS
0.1/ 100
METRIC RATING
277th/ 347
METRIC RANK
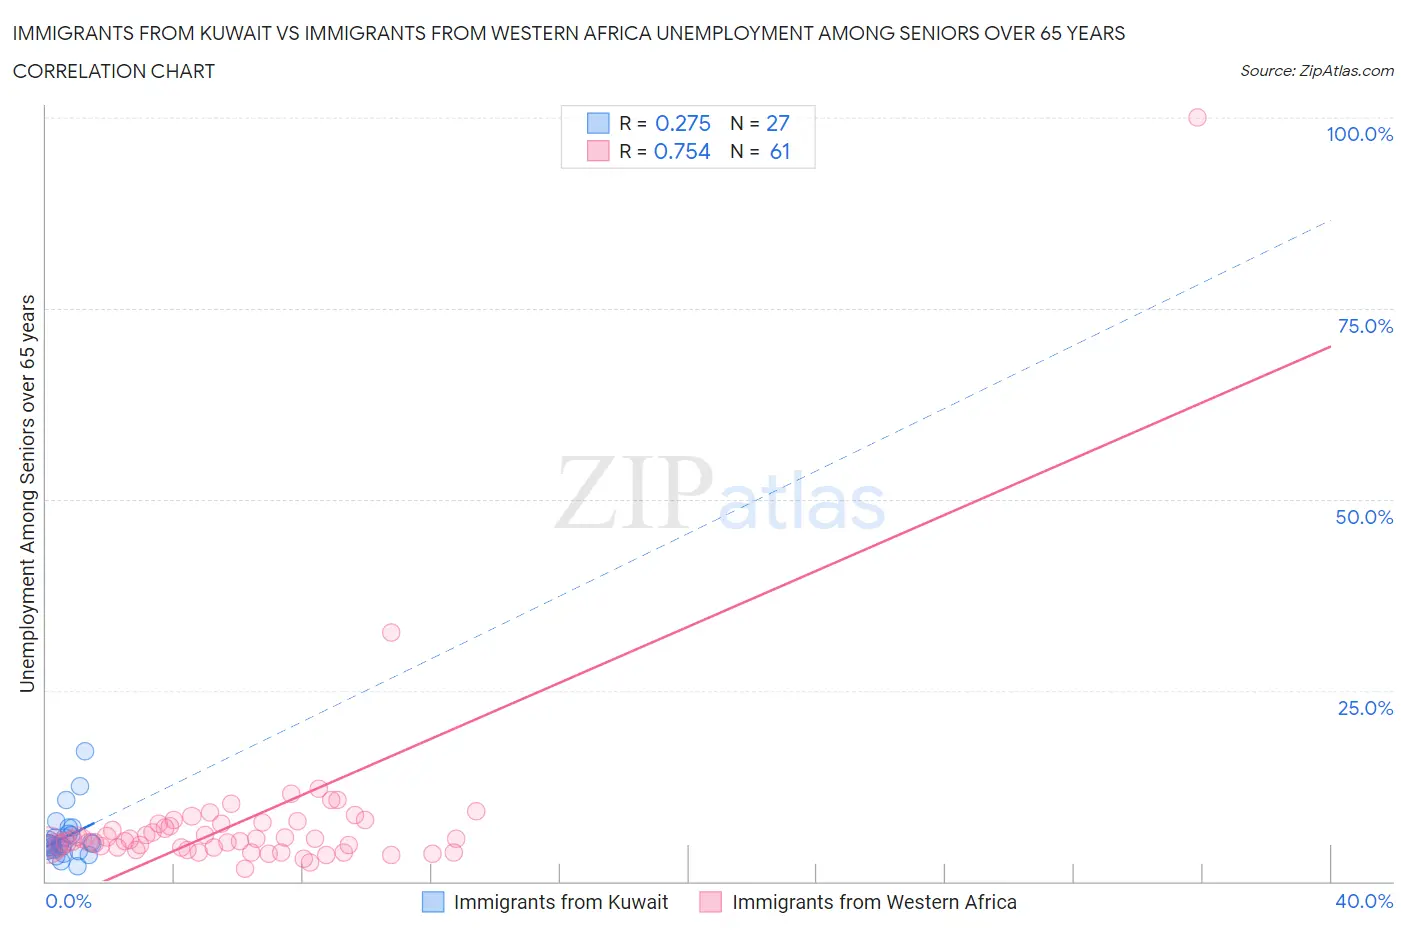
Immigrants from Kuwait vs Immigrants from Western Africa Unemployment Among Seniors over 65 years Correlation Chart
The statistical analysis conducted on geographies consisting of 132,651,314 people shows a weak positive correlation between the proportion of Immigrants from Kuwait and unemployment rate amomg seniors over the age of 65 in the United States with a correlation coefficient (R) of 0.275 and weighted average of 4.8%. Similarly, the statistical analysis conducted on geographies consisting of 328,534,988 people shows a strong positive correlation between the proportion of Immigrants from Western Africa and unemployment rate amomg seniors over the age of 65 in the United States with a correlation coefficient (R) of 0.754 and weighted average of 5.4%, a difference of 12.7%.
Unemployment Among Seniors over 65 years Correlation Summary
| Measurement | Immigrants from Kuwait | Immigrants from Western Africa |
| Minimum | 2.0% | 1.7% |
| Maximum | 17.0% | 100.0% |
| Range | 15.0% | 98.3% |
| Mean | 5.8% | 7.9% |
| Median | 4.9% | 5.5% |
| Interquartile 25% (IQ1) | 4.2% | 4.5% |
| Interquartile 75% (IQ3) | 6.2% | 7.6% |
| Interquartile Range (IQR) | 2.0% | 3.1% |
| Standard Deviation (Sample) | 3.1% | 12.7% |
| Standard Deviation (Population) | 3.1% | 12.6% |
Similar Demographics by Unemployment Among Seniors over 65 years
Demographics Similar to Immigrants from Kuwait by Unemployment Among Seniors over 65 years
In terms of unemployment among seniors over 65 years, the demographic groups most similar to Immigrants from Kuwait are Bhutanese (4.8%, a difference of 0.020%), Cambodian (4.8%, a difference of 0.14%), Bulgarian (4.8%, a difference of 0.15%), Immigrants from India (4.8%, a difference of 0.21%), and Macedonian (4.8%, a difference of 0.24%).
| Demographics | Rating | Rank | Unemployment Among Seniors over 65 years |
| Ugandans | 100.0 /100 | #28 | Exceptional 4.8% |
| Immigrants | North Macedonia | 100.0 /100 | #29 | Exceptional 4.8% |
| Belgians | 100.0 /100 | #30 | Exceptional 4.8% |
| Immigrants | Uganda | 100.0 /100 | #31 | Exceptional 4.8% |
| Slovenes | 100.0 /100 | #32 | Exceptional 4.8% |
| Palestinians | 100.0 /100 | #33 | Exceptional 4.8% |
| Bhutanese | 100.0 /100 | #34 | Exceptional 4.8% |
| Immigrants | Kuwait | 100.0 /100 | #35 | Exceptional 4.8% |
| Cambodians | 100.0 /100 | #36 | Exceptional 4.8% |
| Bulgarians | 99.9 /100 | #37 | Exceptional 4.8% |
| Immigrants | India | 99.9 /100 | #38 | Exceptional 4.8% |
| Macedonians | 99.9 /100 | #39 | Exceptional 4.8% |
| Immigrants | Sweden | 99.9 /100 | #40 | Exceptional 4.8% |
| Kiowa | 99.9 /100 | #41 | Exceptional 4.8% |
| Swiss | 99.9 /100 | #42 | Exceptional 4.8% |
Demographics Similar to Immigrants from Western Africa by Unemployment Among Seniors over 65 years
In terms of unemployment among seniors over 65 years, the demographic groups most similar to Immigrants from Western Africa are Pueblo (5.4%, a difference of 0.030%), Mexican American Indian (5.4%, a difference of 0.060%), Colville (5.4%, a difference of 0.11%), Immigrants from Brazil (5.4%, a difference of 0.19%), and Immigrants from Nigeria (5.4%, a difference of 0.23%).
| Demographics | Rating | Rank | Unemployment Among Seniors over 65 years |
| Immigrants | Morocco | 0.1 /100 | #270 | Tragic 5.4% |
| Cypriots | 0.1 /100 | #271 | Tragic 5.4% |
| Immigrants | Jamaica | 0.1 /100 | #272 | Tragic 5.4% |
| Immigrants | Nigeria | 0.1 /100 | #273 | Tragic 5.4% |
| Immigrants | Brazil | 0.1 /100 | #274 | Tragic 5.4% |
| Mexican American Indians | 0.1 /100 | #275 | Tragic 5.4% |
| Pueblo | 0.1 /100 | #276 | Tragic 5.4% |
| Immigrants | Western Africa | 0.1 /100 | #277 | Tragic 5.4% |
| Colville | 0.1 /100 | #278 | Tragic 5.4% |
| Brazilians | 0.1 /100 | #279 | Tragic 5.5% |
| Immigrants | South America | 0.1 /100 | #280 | Tragic 5.5% |
| Immigrants | Norway | 0.0 /100 | #281 | Tragic 5.5% |
| Immigrants | Belize | 0.0 /100 | #282 | Tragic 5.5% |
| Immigrants | Haiti | 0.0 /100 | #283 | Tragic 5.5% |
| Immigrants | Liberia | 0.0 /100 | #284 | Tragic 5.5% |