Immigrants from Mexico vs Spanish American Indian Unemployment Among Ages 16 to 19 years
COMPARE
Immigrants from Mexico
Spanish American Indian
Unemployment Among Ages 16 to 19 years
Unemployment Among Ages 16 to 19 years Comparison
Immigrants from Mexico
Spanish American Indians
18.9%
UNEMPLOYMENT AMONG AGES 16 TO 19 YEARS
0.2/ 100
METRIC RATING
258th/ 347
METRIC RANK
18.9%
UNEMPLOYMENT AMONG AGES 16 TO 19 YEARS
0.1/ 100
METRIC RATING
261st/ 347
METRIC RANK
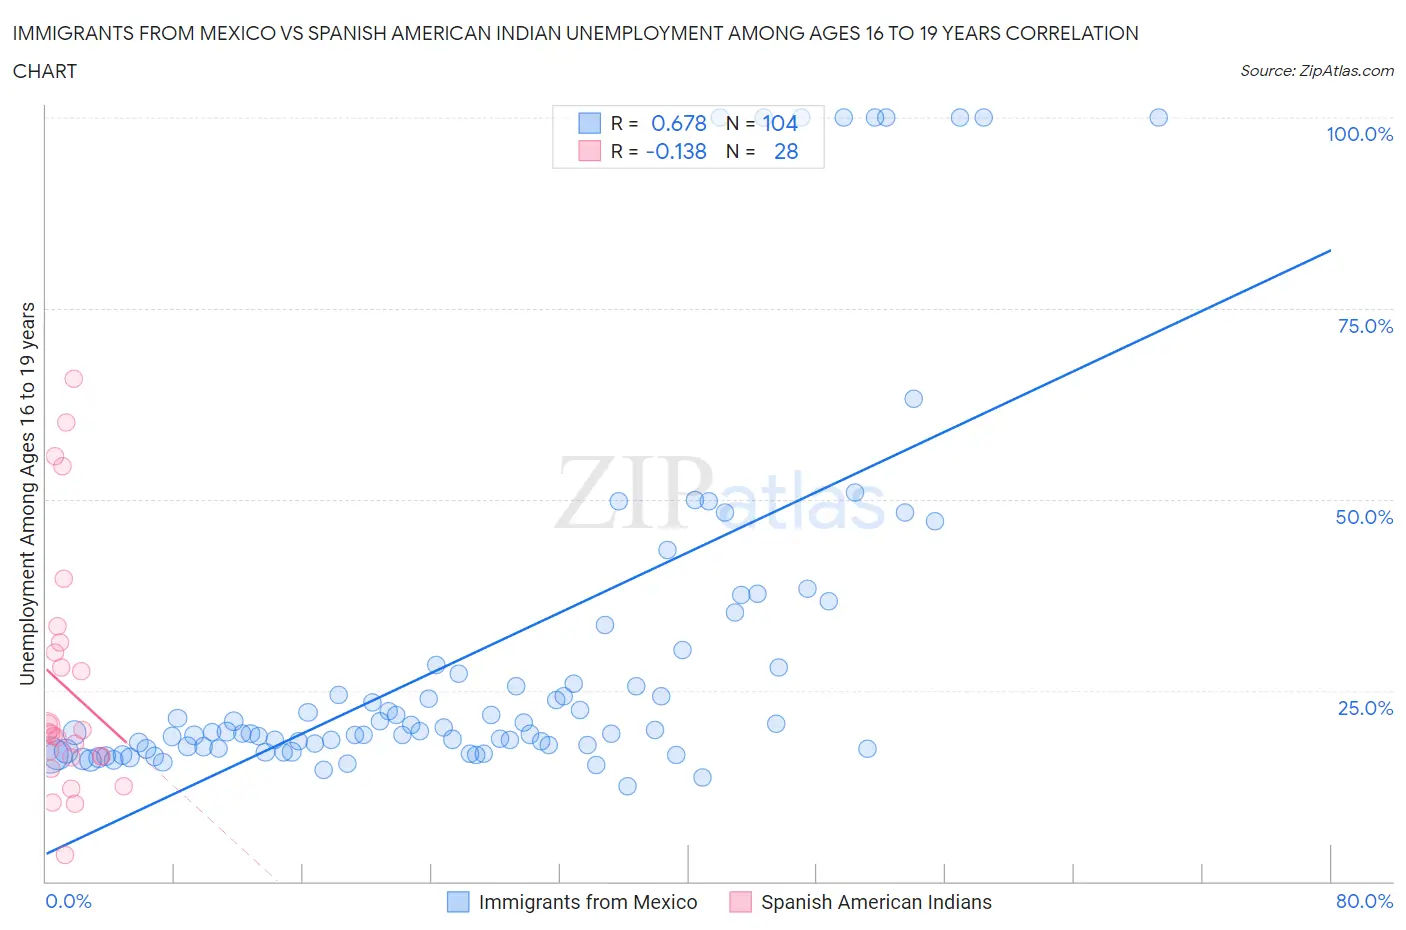
Immigrants from Mexico vs Spanish American Indian Unemployment Among Ages 16 to 19 years Correlation Chart
The statistical analysis conducted on geographies consisting of 472,403,158 people shows a significant positive correlation between the proportion of Immigrants from Mexico and unemployment rate among population between the ages 16 and 19 in the United States with a correlation coefficient (R) of 0.678 and weighted average of 18.9%. Similarly, the statistical analysis conducted on geographies consisting of 72,445,016 people shows a poor negative correlation between the proportion of Spanish American Indians and unemployment rate among population between the ages 16 and 19 in the United States with a correlation coefficient (R) of -0.138 and weighted average of 18.9%, a difference of 0.20%.
Unemployment Among Ages 16 to 19 years Correlation Summary
| Measurement | Immigrants from Mexico | Spanish American Indian |
| Minimum | 12.5% | 3.5% |
| Maximum | 100.0% | 65.8% |
| Range | 87.5% | 62.3% |
| Mean | 30.0% | 25.3% |
| Median | 19.5% | 19.5% |
| Interquartile 25% (IQ1) | 17.3% | 16.2% |
| Interquartile 75% (IQ3) | 28.2% | 30.6% |
| Interquartile Range (IQR) | 10.9% | 14.4% |
| Standard Deviation (Sample) | 23.8% | 16.0% |
| Standard Deviation (Population) | 23.7% | 15.7% |
Demographics Similar to Immigrants from Mexico and Spanish American Indians by Unemployment Among Ages 16 to 19 years
In terms of unemployment among ages 16 to 19 years, the demographic groups most similar to Immigrants from Mexico are Immigrants from Central America (18.9%, a difference of 0.080%), Immigrants from Nigeria (18.9%, a difference of 0.14%), Nigerian (18.9%, a difference of 0.16%), Salvadoran (18.9%, a difference of 0.25%), and Cree (19.0%, a difference of 0.38%). Similarly, the demographic groups most similar to Spanish American Indians are Nigerian (18.9%, a difference of 0.040%), Salvadoran (18.9%, a difference of 0.040%), Immigrants from Central America (18.9%, a difference of 0.12%), Cree (19.0%, a difference of 0.17%), and Yaqui (19.0%, a difference of 0.20%).
| Demographics | Rating | Rank | Unemployment Among Ages 16 to 19 years |
| Puget Sound Salish | 0.5 /100 | #249 | Tragic 18.7% |
| Panamanians | 0.4 /100 | #250 | Tragic 18.7% |
| Sub-Saharan Africans | 0.4 /100 | #251 | Tragic 18.7% |
| Immigrants | Guatemala | 0.4 /100 | #252 | Tragic 18.7% |
| Central Americans | 0.3 /100 | #253 | Tragic 18.8% |
| Apache | 0.3 /100 | #254 | Tragic 18.8% |
| Immigrants | Cameroon | 0.3 /100 | #255 | Tragic 18.8% |
| Mexican American Indians | 0.3 /100 | #256 | Tragic 18.8% |
| Immigrants | Nigeria | 0.2 /100 | #257 | Tragic 18.9% |
| Immigrants | Mexico | 0.2 /100 | #258 | Tragic 18.9% |
| Immigrants | Central America | 0.2 /100 | #259 | Tragic 18.9% |
| Nigerians | 0.2 /100 | #260 | Tragic 18.9% |
| Spanish American Indians | 0.1 /100 | #261 | Tragic 18.9% |
| Salvadorans | 0.1 /100 | #262 | Tragic 18.9% |
| Cree | 0.1 /100 | #263 | Tragic 19.0% |
| Yaqui | 0.1 /100 | #264 | Tragic 19.0% |
| Choctaw | 0.1 /100 | #265 | Tragic 19.0% |
| Immigrants | Honduras | 0.1 /100 | #266 | Tragic 19.0% |
| Israelis | 0.1 /100 | #267 | Tragic 19.0% |
| Immigrants | El Salvador | 0.1 /100 | #268 | Tragic 19.1% |
| Lumbee | 0.1 /100 | #269 | Tragic 19.1% |