Immigrants from Mexico vs Immigrants from Nicaragua Unemployment Among Youth under 25 years
COMPARE
Immigrants from Mexico
Immigrants from Nicaragua
Unemployment Among Youth under 25 years
Unemployment Among Youth under 25 years Comparison
Immigrants from Mexico
Immigrants from Nicaragua
12.4%
UNEMPLOYMENT AMONG YOUTH UNDER 25 YEARS
0.1/ 100
METRIC RATING
262nd/ 347
METRIC RANK
11.2%
UNEMPLOYMENT AMONG YOUTH UNDER 25 YEARS
96.7/ 100
METRIC RATING
78th/ 347
METRIC RANK
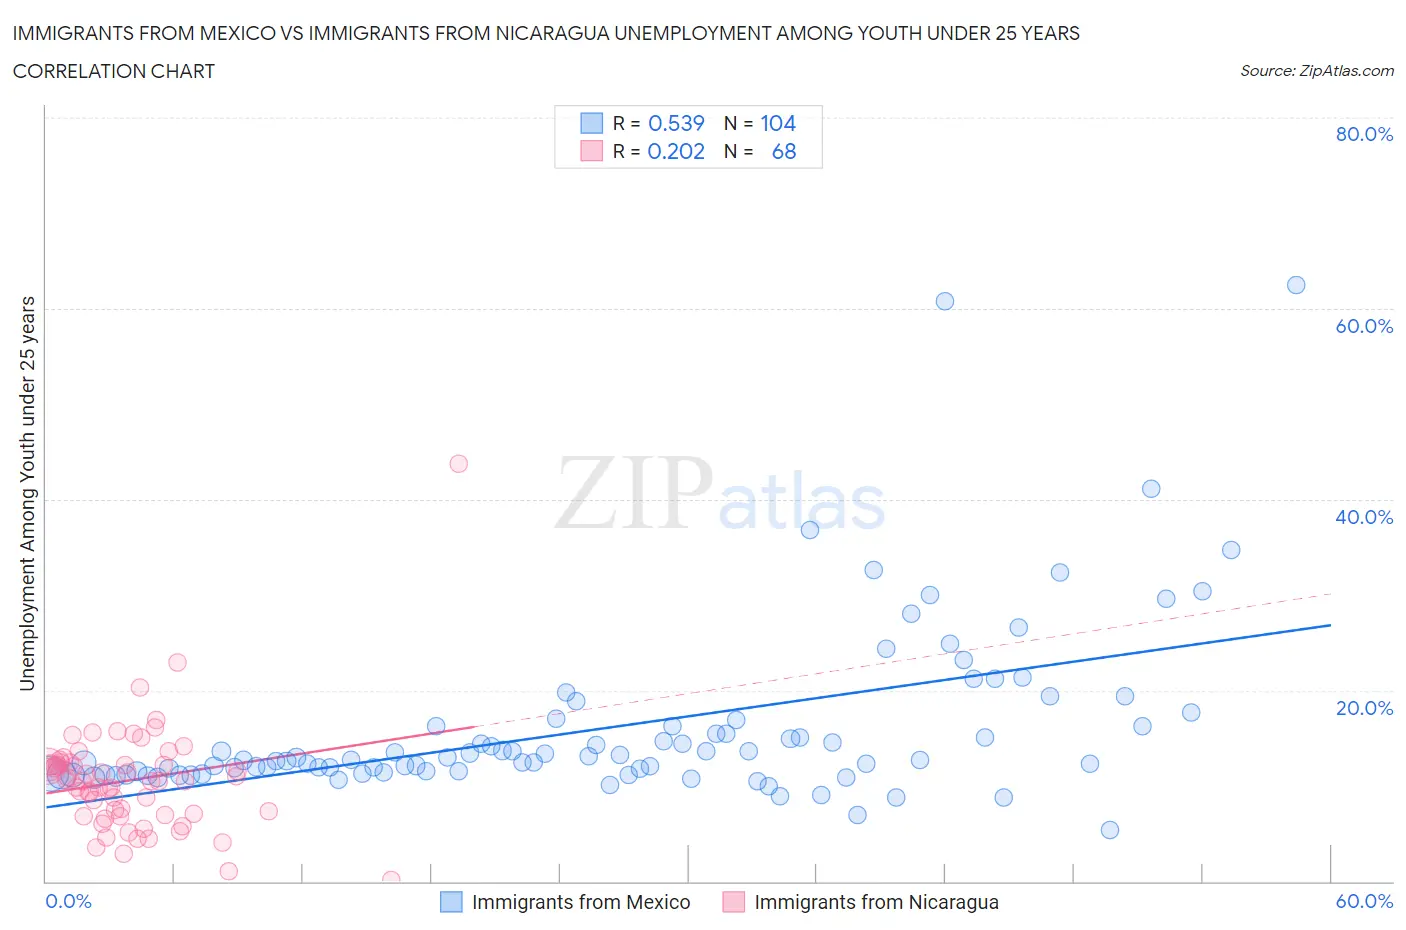
Immigrants from Mexico vs Immigrants from Nicaragua Unemployment Among Youth under 25 years Correlation Chart
The statistical analysis conducted on geographies consisting of 500,400,910 people shows a substantial positive correlation between the proportion of Immigrants from Mexico and unemployment rate among youth under the age of 25 in the United States with a correlation coefficient (R) of 0.539 and weighted average of 12.4%. Similarly, the statistical analysis conducted on geographies consisting of 235,323,133 people shows a weak positive correlation between the proportion of Immigrants from Nicaragua and unemployment rate among youth under the age of 25 in the United States with a correlation coefficient (R) of 0.202 and weighted average of 11.2%, a difference of 11.0%.
Unemployment Among Youth under 25 years Correlation Summary
| Measurement | Immigrants from Mexico | Immigrants from Nicaragua |
| Minimum | 5.4% | 0.10% |
| Maximum | 62.5% | 43.7% |
| Range | 57.1% | 43.6% |
| Mean | 16.1% | 10.6% |
| Median | 12.7% | 10.5% |
| Interquartile 25% (IQ1) | 11.4% | 7.0% |
| Interquartile 75% (IQ3) | 16.3% | 12.4% |
| Interquartile Range (IQR) | 4.9% | 5.3% |
| Standard Deviation (Sample) | 9.2% | 5.9% |
| Standard Deviation (Population) | 9.2% | 5.8% |
Similar Demographics by Unemployment Among Youth under 25 years
Demographics Similar to Immigrants from Mexico by Unemployment Among Youth under 25 years
In terms of unemployment among youth under 25 years, the demographic groups most similar to Immigrants from Mexico are Immigrants from El Salvador (12.4%, a difference of 0.050%), Immigrants from Panama (12.4%, a difference of 0.060%), Cree (12.4%, a difference of 0.090%), Immigrants from Central America (12.4%, a difference of 0.36%), and Salvadoran (12.4%, a difference of 0.42%).
| Demographics | Rating | Rank | Unemployment Among Youth under 25 years |
| Hispanics or Latinos | 0.2 /100 | #255 | Tragic 12.4% |
| Liberians | 0.2 /100 | #256 | Tragic 12.4% |
| Panamanians | 0.2 /100 | #257 | Tragic 12.4% |
| Salvadorans | 0.1 /100 | #258 | Tragic 12.4% |
| Immigrants | Central America | 0.1 /100 | #259 | Tragic 12.4% |
| Immigrants | Panama | 0.1 /100 | #260 | Tragic 12.4% |
| Immigrants | El Salvador | 0.1 /100 | #261 | Tragic 12.4% |
| Immigrants | Mexico | 0.1 /100 | #262 | Tragic 12.4% |
| Cree | 0.1 /100 | #263 | Tragic 12.4% |
| Puget Sound Salish | 0.1 /100 | #264 | Tragic 12.5% |
| Nepalese | 0.0 /100 | #265 | Tragic 12.5% |
| Immigrants | Latin America | 0.0 /100 | #266 | Tragic 12.6% |
| Sub-Saharan Africans | 0.0 /100 | #267 | Tragic 12.6% |
| Tlingit-Haida | 0.0 /100 | #268 | Tragic 12.7% |
| Kiowa | 0.0 /100 | #269 | Tragic 12.7% |
Demographics Similar to Immigrants from Nicaragua by Unemployment Among Youth under 25 years
In terms of unemployment among youth under 25 years, the demographic groups most similar to Immigrants from Nicaragua are Immigrants from Canada (11.2%, a difference of 0.010%), White/Caucasian (11.2%, a difference of 0.060%), Immigrants from Bulgaria (11.2%, a difference of 0.090%), German Russian (11.2%, a difference of 0.11%), and French (11.2%, a difference of 0.13%).
| Demographics | Rating | Rank | Unemployment Among Youth under 25 years |
| Bhutanese | 97.4 /100 | #71 | Exceptional 11.2% |
| Immigrants | Australia | 97.3 /100 | #72 | Exceptional 11.2% |
| Creek | 97.2 /100 | #73 | Exceptional 11.2% |
| New Zealanders | 97.2 /100 | #74 | Exceptional 11.2% |
| French | 97.1 /100 | #75 | Exceptional 11.2% |
| German Russians | 97.0 /100 | #76 | Exceptional 11.2% |
| Whites/Caucasians | 96.9 /100 | #77 | Exceptional 11.2% |
| Immigrants | Nicaragua | 96.7 /100 | #78 | Exceptional 11.2% |
| Immigrants | Canada | 96.7 /100 | #79 | Exceptional 11.2% |
| Immigrants | Bulgaria | 96.4 /100 | #80 | Exceptional 11.2% |
| Icelanders | 96.3 /100 | #81 | Exceptional 11.2% |
| Northern Europeans | 96.2 /100 | #82 | Exceptional 11.2% |
| Bolivians | 96.1 /100 | #83 | Exceptional 11.2% |
| French Canadians | 95.9 /100 | #84 | Exceptional 11.2% |
| Immigrants | South Central Asia | 95.9 /100 | #85 | Exceptional 11.2% |