Tsimshian vs Immigrants from Nicaragua Unemployment Among Youth under 25 years
COMPARE
Tsimshian
Immigrants from Nicaragua
Unemployment Among Youth under 25 years
Unemployment Among Youth under 25 years Comparison
Tsimshian
Immigrants from Nicaragua
16.5%
UNEMPLOYMENT AMONG YOUTH UNDER 25 YEARS
0.0/ 100
METRIC RATING
339th/ 347
METRIC RANK
11.2%
UNEMPLOYMENT AMONG YOUTH UNDER 25 YEARS
96.7/ 100
METRIC RATING
78th/ 347
METRIC RANK
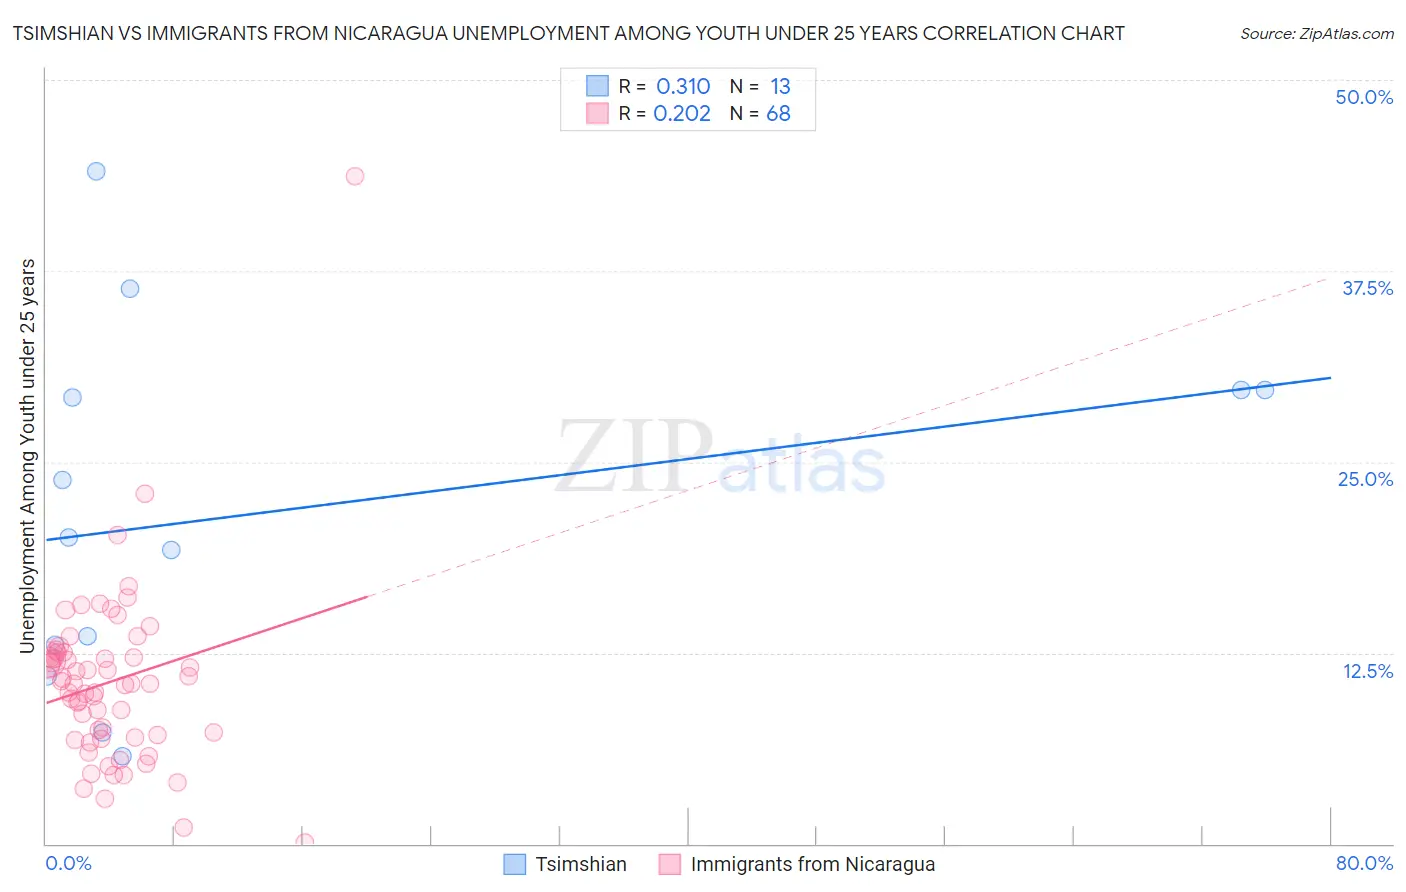
Tsimshian vs Immigrants from Nicaragua Unemployment Among Youth under 25 years Correlation Chart
The statistical analysis conducted on geographies consisting of 15,601,146 people shows a mild positive correlation between the proportion of Tsimshian and unemployment rate among youth under the age of 25 in the United States with a correlation coefficient (R) of 0.310 and weighted average of 16.5%. Similarly, the statistical analysis conducted on geographies consisting of 235,323,133 people shows a weak positive correlation between the proportion of Immigrants from Nicaragua and unemployment rate among youth under the age of 25 in the United States with a correlation coefficient (R) of 0.202 and weighted average of 11.2%, a difference of 47.2%.
Unemployment Among Youth under 25 years Correlation Summary
| Measurement | Tsimshian | Immigrants from Nicaragua |
| Minimum | 5.7% | 0.10% |
| Maximum | 44.0% | 43.7% |
| Range | 38.3% | 43.6% |
| Mean | 21.7% | 10.6% |
| Median | 20.1% | 10.5% |
| Interquartile 25% (IQ1) | 12.0% | 7.0% |
| Interquartile 75% (IQ3) | 29.7% | 12.4% |
| Interquartile Range (IQR) | 17.7% | 5.3% |
| Standard Deviation (Sample) | 11.6% | 5.9% |
| Standard Deviation (Population) | 11.2% | 5.8% |
Similar Demographics by Unemployment Among Youth under 25 years
Demographics Similar to Tsimshian by Unemployment Among Youth under 25 years
In terms of unemployment among youth under 25 years, the demographic groups most similar to Tsimshian are Yuman (16.3%, a difference of 1.0%), Arapaho (16.3%, a difference of 1.3%), Pima (16.2%, a difference of 1.5%), Colville (16.8%, a difference of 1.7%), and Immigrants from St. Vincent and the Grenadines (16.1%, a difference of 2.1%).
| Demographics | Rating | Rank | Unemployment Among Youth under 25 years |
| Immigrants | Grenada | 0.0 /100 | #332 | Tragic 15.8% |
| Guyanese | 0.0 /100 | #333 | Tragic 15.9% |
| Immigrants | Guyana | 0.0 /100 | #334 | Tragic 15.9% |
| Immigrants | St. Vincent and the Grenadines | 0.0 /100 | #335 | Tragic 16.1% |
| Pima | 0.0 /100 | #336 | Tragic 16.2% |
| Arapaho | 0.0 /100 | #337 | Tragic 16.3% |
| Yuman | 0.0 /100 | #338 | Tragic 16.3% |
| Tsimshian | 0.0 /100 | #339 | Tragic 16.5% |
| Colville | 0.0 /100 | #340 | Tragic 16.8% |
| Paiute | 0.0 /100 | #341 | Tragic 17.6% |
| Puerto Ricans | 0.0 /100 | #342 | Tragic 18.4% |
| Navajo | 0.0 /100 | #343 | Tragic 18.6% |
| Crow | 0.0 /100 | #344 | Tragic 20.1% |
| Hopi | 0.0 /100 | #345 | Tragic 21.5% |
| Inupiat | 0.0 /100 | #346 | Tragic 22.0% |
Demographics Similar to Immigrants from Nicaragua by Unemployment Among Youth under 25 years
In terms of unemployment among youth under 25 years, the demographic groups most similar to Immigrants from Nicaragua are Immigrants from Canada (11.2%, a difference of 0.010%), White/Caucasian (11.2%, a difference of 0.060%), Immigrants from Bulgaria (11.2%, a difference of 0.090%), German Russian (11.2%, a difference of 0.11%), and French (11.2%, a difference of 0.13%).
| Demographics | Rating | Rank | Unemployment Among Youth under 25 years |
| Bhutanese | 97.4 /100 | #71 | Exceptional 11.2% |
| Immigrants | Australia | 97.3 /100 | #72 | Exceptional 11.2% |
| Creek | 97.2 /100 | #73 | Exceptional 11.2% |
| New Zealanders | 97.2 /100 | #74 | Exceptional 11.2% |
| French | 97.1 /100 | #75 | Exceptional 11.2% |
| German Russians | 97.0 /100 | #76 | Exceptional 11.2% |
| Whites/Caucasians | 96.9 /100 | #77 | Exceptional 11.2% |
| Immigrants | Nicaragua | 96.7 /100 | #78 | Exceptional 11.2% |
| Immigrants | Canada | 96.7 /100 | #79 | Exceptional 11.2% |
| Immigrants | Bulgaria | 96.4 /100 | #80 | Exceptional 11.2% |
| Icelanders | 96.3 /100 | #81 | Exceptional 11.2% |
| Northern Europeans | 96.2 /100 | #82 | Exceptional 11.2% |
| Bolivians | 96.1 /100 | #83 | Exceptional 11.2% |
| French Canadians | 95.9 /100 | #84 | Exceptional 11.2% |
| Immigrants | South Central Asia | 95.9 /100 | #85 | Exceptional 11.2% |