Immigrants from Mexico vs Fijian Unemployment Among Ages 30 to 34 years
COMPARE
Immigrants from Mexico
Fijian
Unemployment Among Ages 30 to 34 years
Unemployment Among Ages 30 to 34 years Comparison
Immigrants from Mexico
Fijians
6.2%
UNEMPLOYMENT AMONG AGES 30 TO 34 YEARS
0.0/ 100
METRIC RATING
267th/ 347
METRIC RANK
5.0%
UNEMPLOYMENT AMONG AGES 30 TO 34 YEARS
99.0/ 100
METRIC RATING
39th/ 347
METRIC RANK
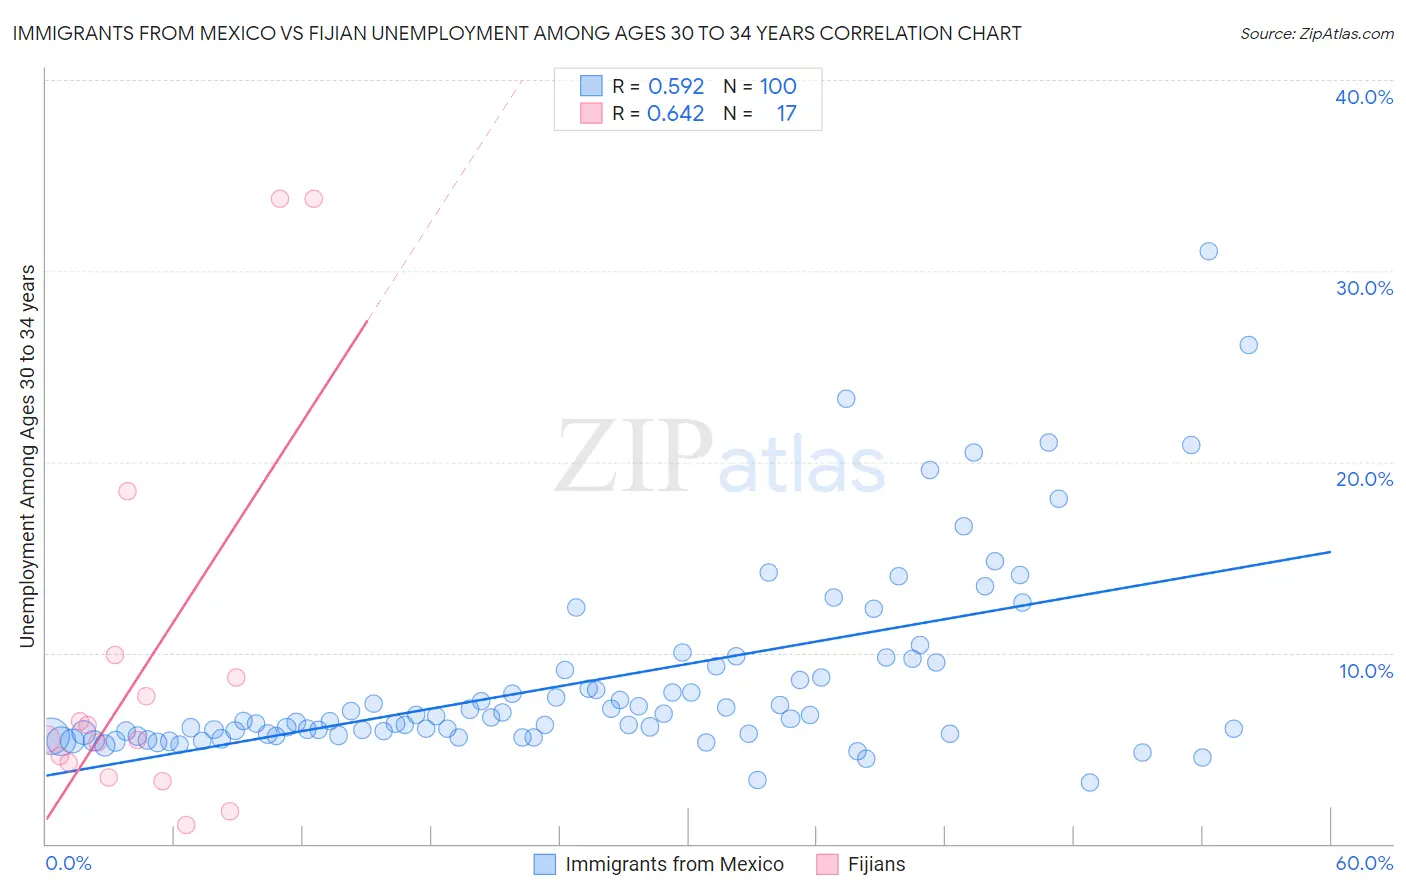
Immigrants from Mexico vs Fijian Unemployment Among Ages 30 to 34 years Correlation Chart
The statistical analysis conducted on geographies consisting of 465,610,676 people shows a substantial positive correlation between the proportion of Immigrants from Mexico and unemployment rate among population between the ages 30 and 34 in the United States with a correlation coefficient (R) of 0.592 and weighted average of 6.2%. Similarly, the statistical analysis conducted on geographies consisting of 55,070,500 people shows a significant positive correlation between the proportion of Fijians and unemployment rate among population between the ages 30 and 34 in the United States with a correlation coefficient (R) of 0.642 and weighted average of 5.0%, a difference of 23.9%.
Unemployment Among Ages 30 to 34 years Correlation Summary
| Measurement | Immigrants from Mexico | Fijian |
| Minimum | 3.2% | 1.0% |
| Maximum | 31.0% | 33.8% |
| Range | 27.8% | 32.8% |
| Mean | 8.5% | 9.4% |
| Median | 6.5% | 5.5% |
| Interquartile 25% (IQ1) | 5.7% | 3.8% |
| Interquartile 75% (IQ3) | 9.2% | 9.3% |
| Interquartile Range (IQR) | 3.5% | 5.5% |
| Standard Deviation (Sample) | 5.0% | 10.0% |
| Standard Deviation (Population) | 5.0% | 9.7% |
Similar Demographics by Unemployment Among Ages 30 to 34 years
Demographics Similar to Immigrants from Mexico by Unemployment Among Ages 30 to 34 years
In terms of unemployment among ages 30 to 34 years, the demographic groups most similar to Immigrants from Mexico are Immigrants from Haiti (6.2%, a difference of 0.16%), Seminole (6.2%, a difference of 0.20%), American (6.2%, a difference of 0.29%), Chickasaw (6.2%, a difference of 0.40%), and Spanish American (6.2%, a difference of 0.45%).
| Demographics | Rating | Rank | Unemployment Among Ages 30 to 34 years |
| Immigrants | Latin America | 0.1 /100 | #260 | Tragic 6.1% |
| Immigrants | Western Africa | 0.1 /100 | #261 | Tragic 6.2% |
| Immigrants | Central America | 0.1 /100 | #262 | Tragic 6.2% |
| Spanish Americans | 0.0 /100 | #263 | Tragic 6.2% |
| Chickasaw | 0.0 /100 | #264 | Tragic 6.2% |
| Americans | 0.0 /100 | #265 | Tragic 6.2% |
| Seminole | 0.0 /100 | #266 | Tragic 6.2% |
| Immigrants | Mexico | 0.0 /100 | #267 | Tragic 6.2% |
| Immigrants | Haiti | 0.0 /100 | #268 | Tragic 6.2% |
| French American Indians | 0.0 /100 | #269 | Tragic 6.3% |
| Immigrants | Senegal | 0.0 /100 | #270 | Tragic 6.3% |
| Comanche | 0.0 /100 | #271 | Tragic 6.3% |
| Blackfeet | 0.0 /100 | #272 | Tragic 6.3% |
| Ottawa | 0.0 /100 | #273 | Tragic 6.3% |
| U.S. Virgin Islanders | 0.0 /100 | #274 | Tragic 6.3% |
Demographics Similar to Fijians by Unemployment Among Ages 30 to 34 years
In terms of unemployment among ages 30 to 34 years, the demographic groups most similar to Fijians are Immigrants from Vietnam (5.0%, a difference of 0.080%), Immigrants from Eastern Africa (5.0%, a difference of 0.080%), Immigrants from Turkey (5.0%, a difference of 0.10%), Sri Lankan (5.0%, a difference of 0.10%), and Immigrants from Hong Kong (5.0%, a difference of 0.27%).
| Demographics | Rating | Rank | Unemployment Among Ages 30 to 34 years |
| Immigrants | Zaire | 99.3 /100 | #32 | Exceptional 5.0% |
| Immigrants | Saudi Arabia | 99.3 /100 | #33 | Exceptional 5.0% |
| Latvians | 99.3 /100 | #34 | Exceptional 5.0% |
| Immigrants | Ethiopia | 99.2 /100 | #35 | Exceptional 5.0% |
| Czechs | 99.2 /100 | #36 | Exceptional 5.0% |
| Immigrants | Turkey | 99.0 /100 | #37 | Exceptional 5.0% |
| Sri Lankans | 99.0 /100 | #38 | Exceptional 5.0% |
| Fijians | 99.0 /100 | #39 | Exceptional 5.0% |
| Immigrants | Vietnam | 98.9 /100 | #40 | Exceptional 5.0% |
| Immigrants | Eastern Africa | 98.9 /100 | #41 | Exceptional 5.0% |
| Immigrants | Hong Kong | 98.8 /100 | #42 | Exceptional 5.0% |
| Soviet Union | 98.8 /100 | #43 | Exceptional 5.0% |
| Immigrants | Belgium | 98.7 /100 | #44 | Exceptional 5.1% |
| Yugoslavians | 98.6 /100 | #45 | Exceptional 5.1% |
| Immigrants | Congo | 98.4 /100 | #46 | Exceptional 5.1% |